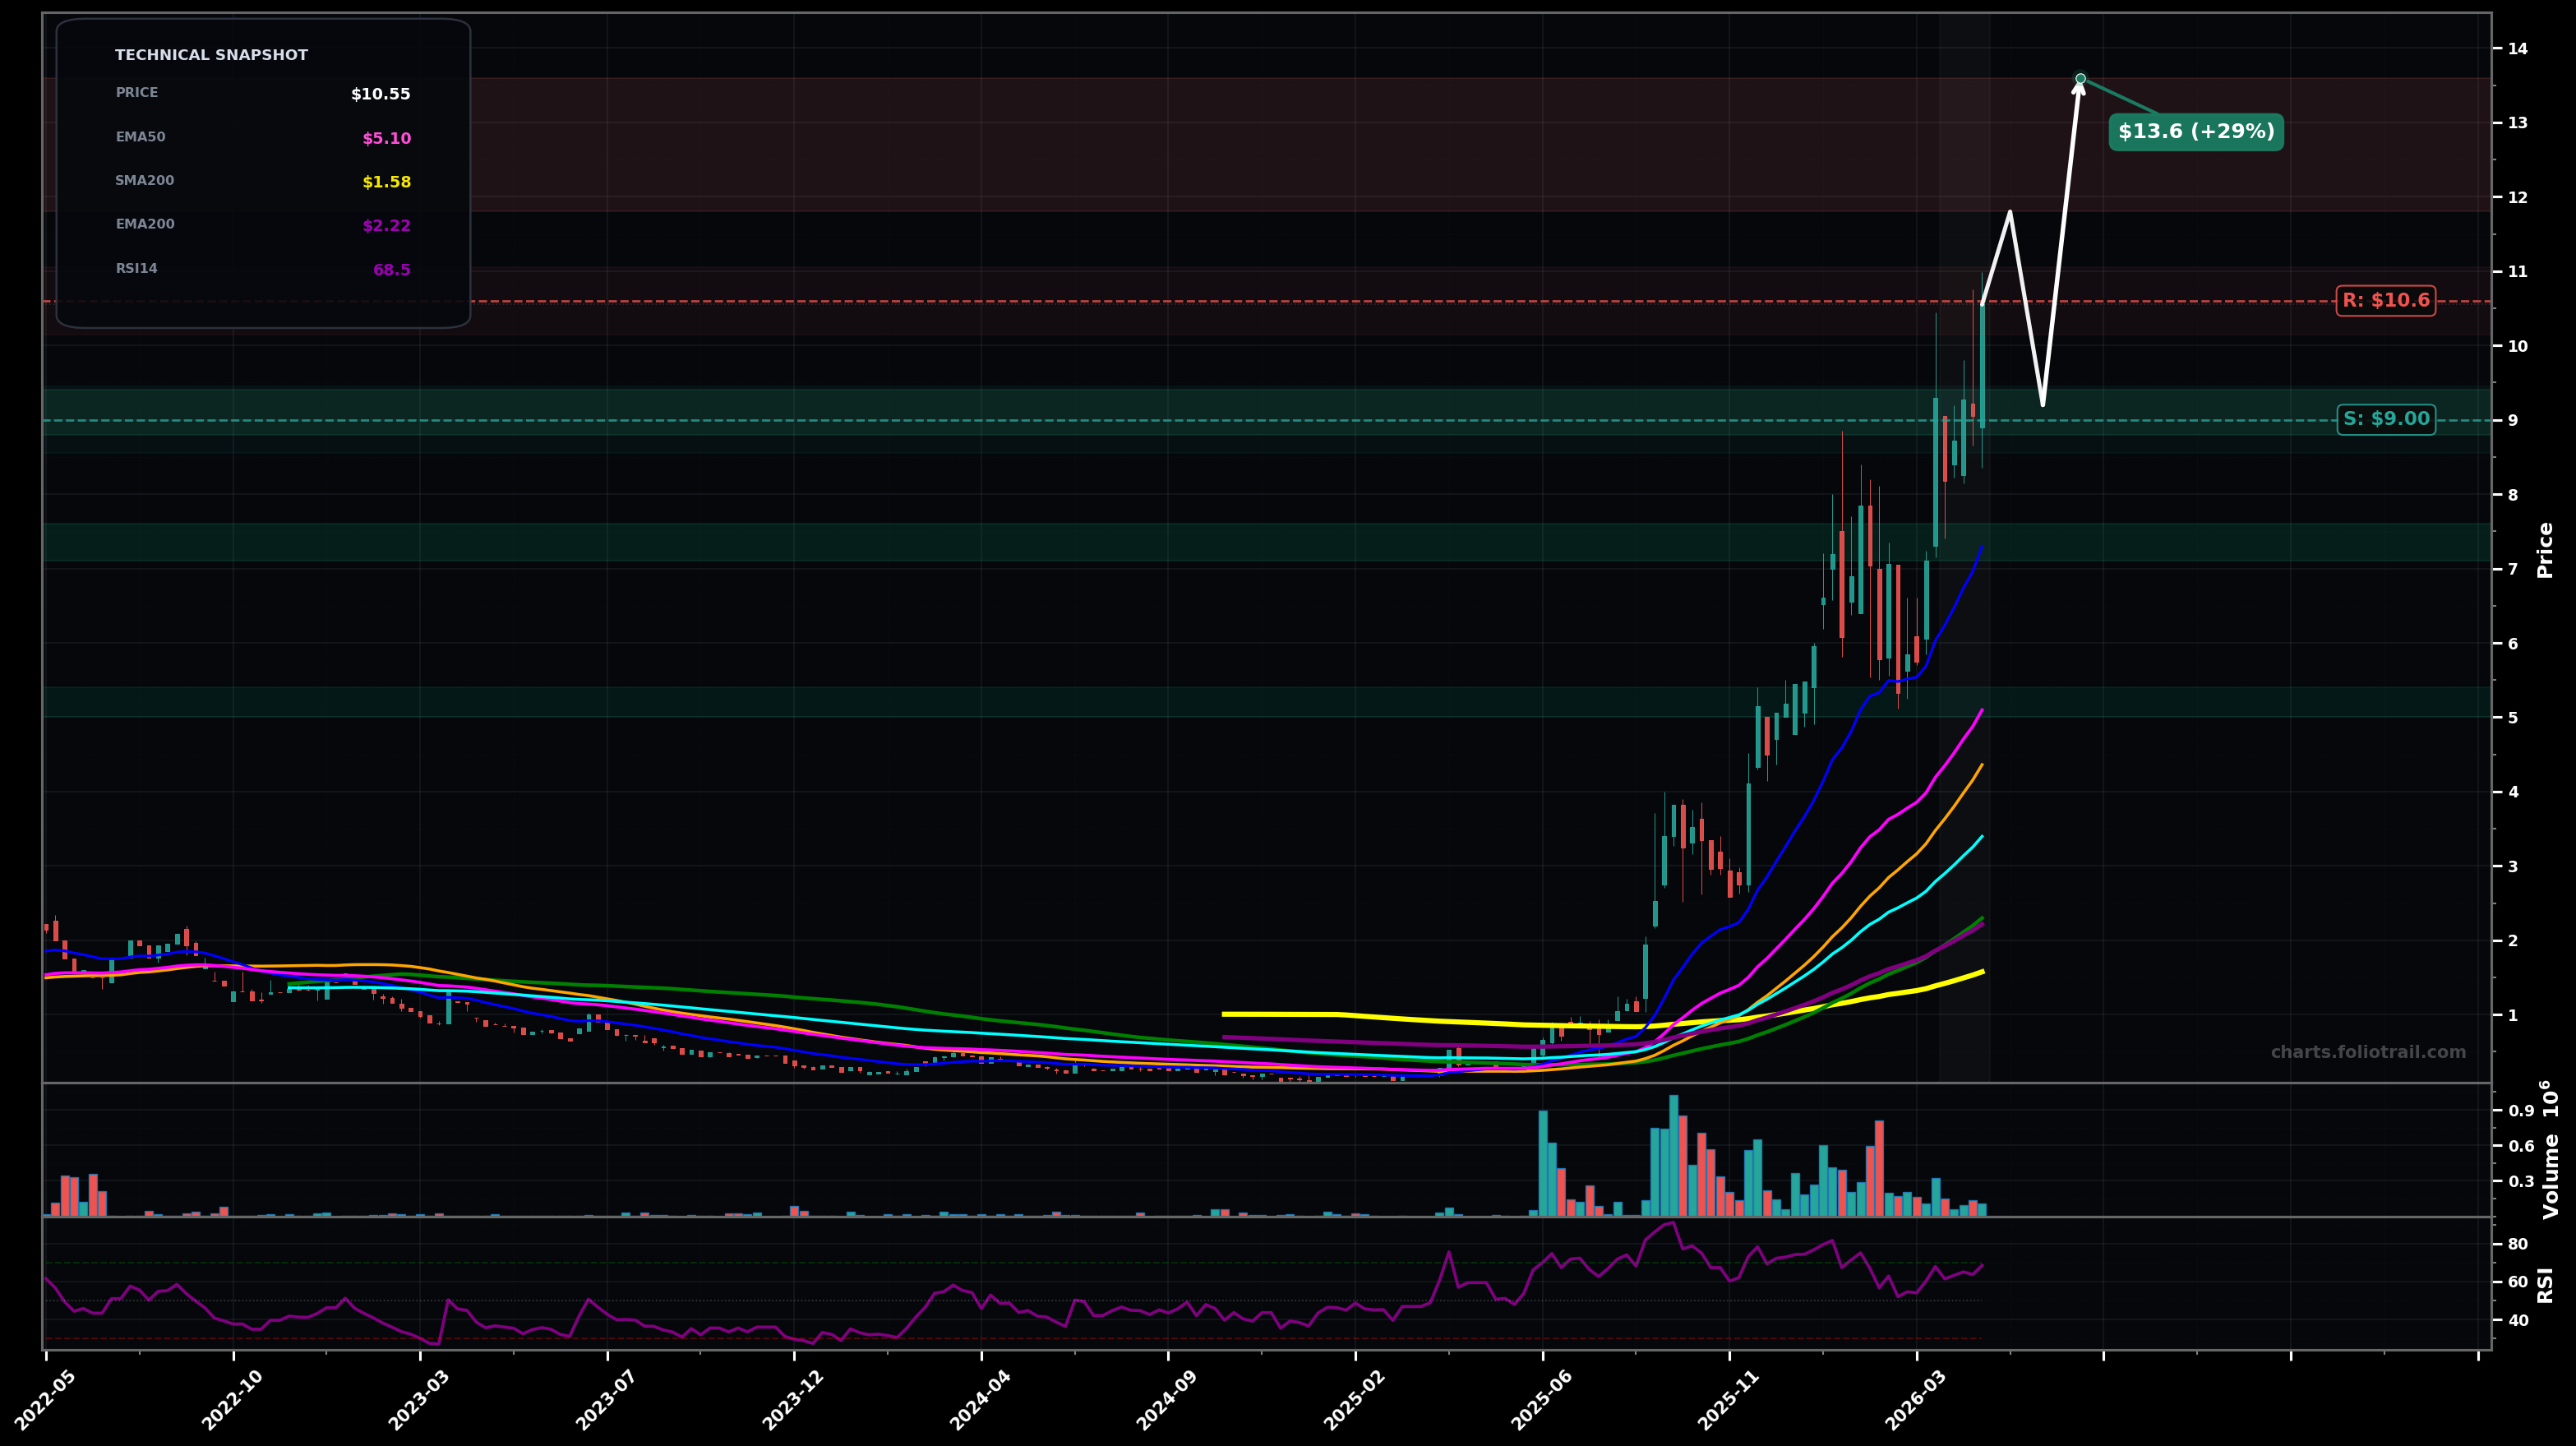
As of May 22, 2026, SREMF (Sunrise Energy Metals Limited) is in a parabolic state on the weekly chart, with a confidence level of 74%. Key support is at $9.00 and key resistance at $10.6. Sharp weekly momentum push to new swing highs around $10.5 with price extended well above EMA50/EMA100; RSI ~68 (near overbought).
Bullish continuation after a brief digestion: price consolidates above prior breakout area, then attempts another leg up (Elliott: extending Wave 3 or starting Wave 5). Fib extension from the last impulse suggests a push toward the next extension zone.
Mean-reversion pullback: parabolic leg cools off with a deeper retrace toward rising moving averages (Elliott: Wave 4-type correction), then attempts to base and re-attack highs.
2+ weekly closes holding above $9.00 while EMA50 (pink) keeps rising
Weekly close below $7.30 (EMA20 area) would signal parabolic break and deeper mean reversion risk
Buy-the-dip zones aligned to prior breakout/round-number support (~$9), then EMA20/structure (~$7.3), then EMA50 (pink) mean-reversion (~$5.1) if correction deepens.
Trim into Fib-extension/vertical-move zones where price is likely to be most stretched vs rising EMA50/EMA100; progressively reduce as extensions grow and reversal risk increases.
As of May 22, 2026, SREMF (Sunrise Energy Metals Limited) is in a parabolic state on the weekly chart with 74% confidence. Sharp weekly momentum push to new swing highs around $10.5 with price extended well above EMA50/EMA100; RSI ~68 (near overbought).
On the weekly timeframe, SREMF has key support at $9.00 and key resistance at $10.6. The most likely scenario (bullish) targets $11.8 and $13.6, with a revert level at $9.20.
SREMF (Sunrise Energy Metals Limited) is currently classified as parabolic on the weekly chart, with 74% confidence. Confirmation requires: 2+ weekly closes holding above $9.00 while EMA50 (pink) keeps rising This would be invalidated by: Weekly close below $7.30 (EMA20 area) would signal parabolic break and deeper mean reversion risk
The most likely scenario (bullish) targets $11.8 and $13.6, with a revert level at $9.20. The alternative scenario (bearish) targets $7.30 and $5.10.
Multi-layer AI agents analyse 200+ stocks across daily, weekly, and monthly timeframes — producing market state classifications, price scenarios with targets, and position entry/exit levels. Daily charts updated every trading day at 6 PM ET. Weekly charts refresh Fridays. Monthly charts refresh on the last trading day of each month. No paywall. No sign-up required.
Built by Foliotrail.
All content on this website — including charts, analysis, price targets, support/resistance levels, and position zones — is generated entirely by AI and provided for educational and informational purposes only.
This is not financial advice. NEXUSNOIR VENTURES SL (the operator of this website) is not a registered investment adviser or broker-dealer. You should not make investment decisions based solely on this information. Always do your own research and consult a qualified financial advisor.
By continuing, you acknowledge that you have read and agree to our full disclaimer & terms of use and privacy policy.