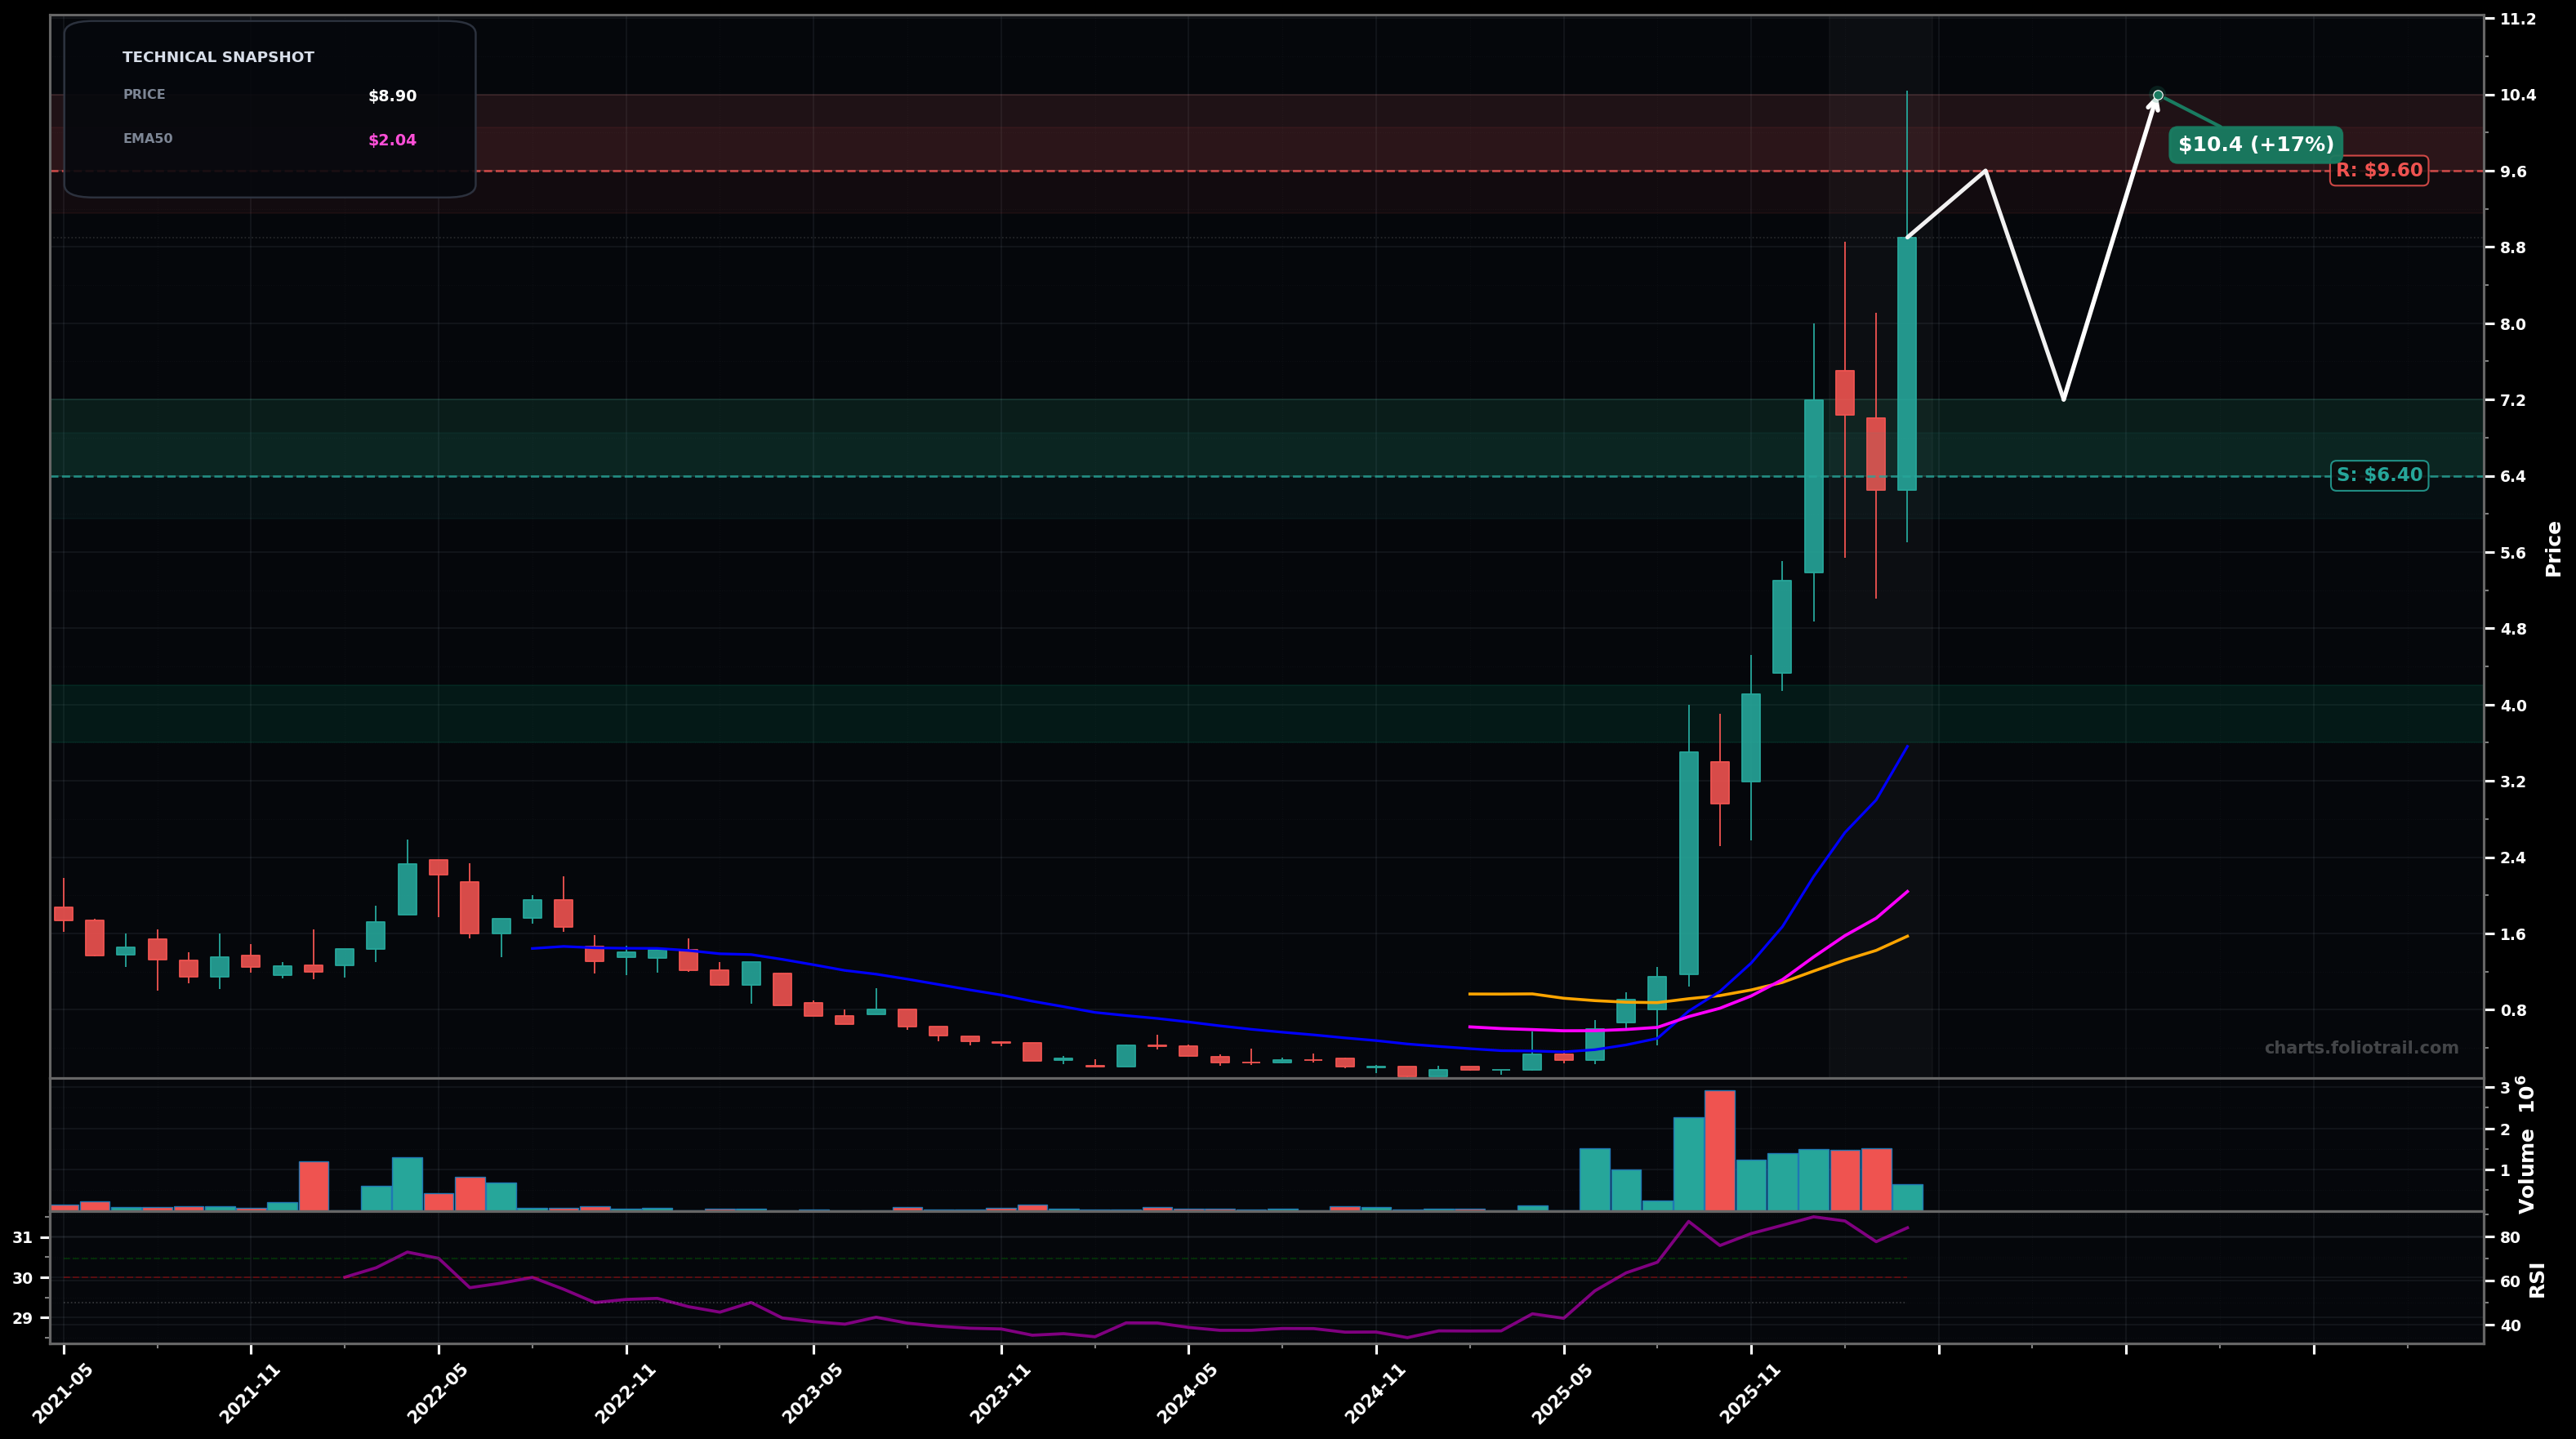
As of April 30, 2026, SREMF (Sunrise Energy Metals Limited) is in a parabolic state on the monthly chart, with a confidence level of 76%. Key support is at $6.40 and key resistance at $9.60. Monthly vertical rally to new swing highs with volatile pullback/rebound; price ~$8.90 far above rising EMA50/EMA200; RSI-14 ~83 (overbought).
Bullish continuation: price digests via a shallow pullback/chop above $6.40 then attempts a breakout over the recent peak; fits an Elliott Wave impulse where this is wave (3)/(5) extension and needs a brief wave (4) consolidation first.
Mean-reversion/correction: parabolic move unwinds into a deeper wave (4) / A-B-C pullback toward rising MAs; first support test around $6.40, and if that fails a larger retrace toward the prior breakout zone and EMA200 area.
Monthly close above $9.00 and then a higher low holding above $6.40
Monthly close below $6.40 (breaks the most recent swing-low reference/structure support)
Buy zones are anchored to the most recent swing-low reference (~$6.40), a likely Fibonacci retrace pocket (mid-$5s) and the EMA200 (purple) region (~$3.6) as deeper wave-(4)/ABC supports.
Trim into prior highs/extension levels because price is already far above EMA50/EMA200 with RSI extreme; higher bands represent Fibonacci extensions where multi-year forward returns get increasingly asymmetric.
As of April 30, 2026, SREMF (Sunrise Energy Metals Limited) is in a parabolic state on the monthly chart with 76% confidence. Monthly vertical rally to new swing highs with volatile pullback/rebound; price ~$8.90 far above rising EMA50/EMA200; RSI-14 ~83 (overbought).
On the monthly timeframe, SREMF has key support at $6.40 and key resistance at $9.60. The most likely scenario (bullish) targets $9.60 and $10.4, with a revert level at $7.20.
SREMF (Sunrise Energy Metals Limited) is currently classified as parabolic on the monthly chart, with 76% confidence. Confirmation requires: Monthly close above $9.00 and then a higher low holding above $6.40 This would be invalidated by: Monthly close below $6.40 (breaks the most recent swing-low reference/structure support)
The most likely scenario (bullish) targets $9.60 and $10.4, with a revert level at $7.20. The alternative scenario (bearish) targets $6.40 and $4.80.
Multi-layer AI agents analyse 200+ stocks across daily, weekly, and monthly timeframes — producing market state classifications, price scenarios with targets, and position entry/exit levels. Daily charts updated every trading day at 6 PM ET. Weekly charts refresh Fridays. Monthly charts refresh on the last trading day of each month. No paywall. No sign-up required.
Built by Foliotrail.
All content on this website — including charts, analysis, price targets, support/resistance levels, and position zones — is generated entirely by AI and provided for educational and informational purposes only.
This is not financial advice. NEXUSNOIR VENTURES SL (the operator of this website) is not a registered investment adviser or broker-dealer. You should not make investment decisions based solely on this information. Always do your own research and consult a qualified financial advisor.
By continuing, you acknowledge that you have read and agree to our full disclaimer & terms of use and privacy policy.