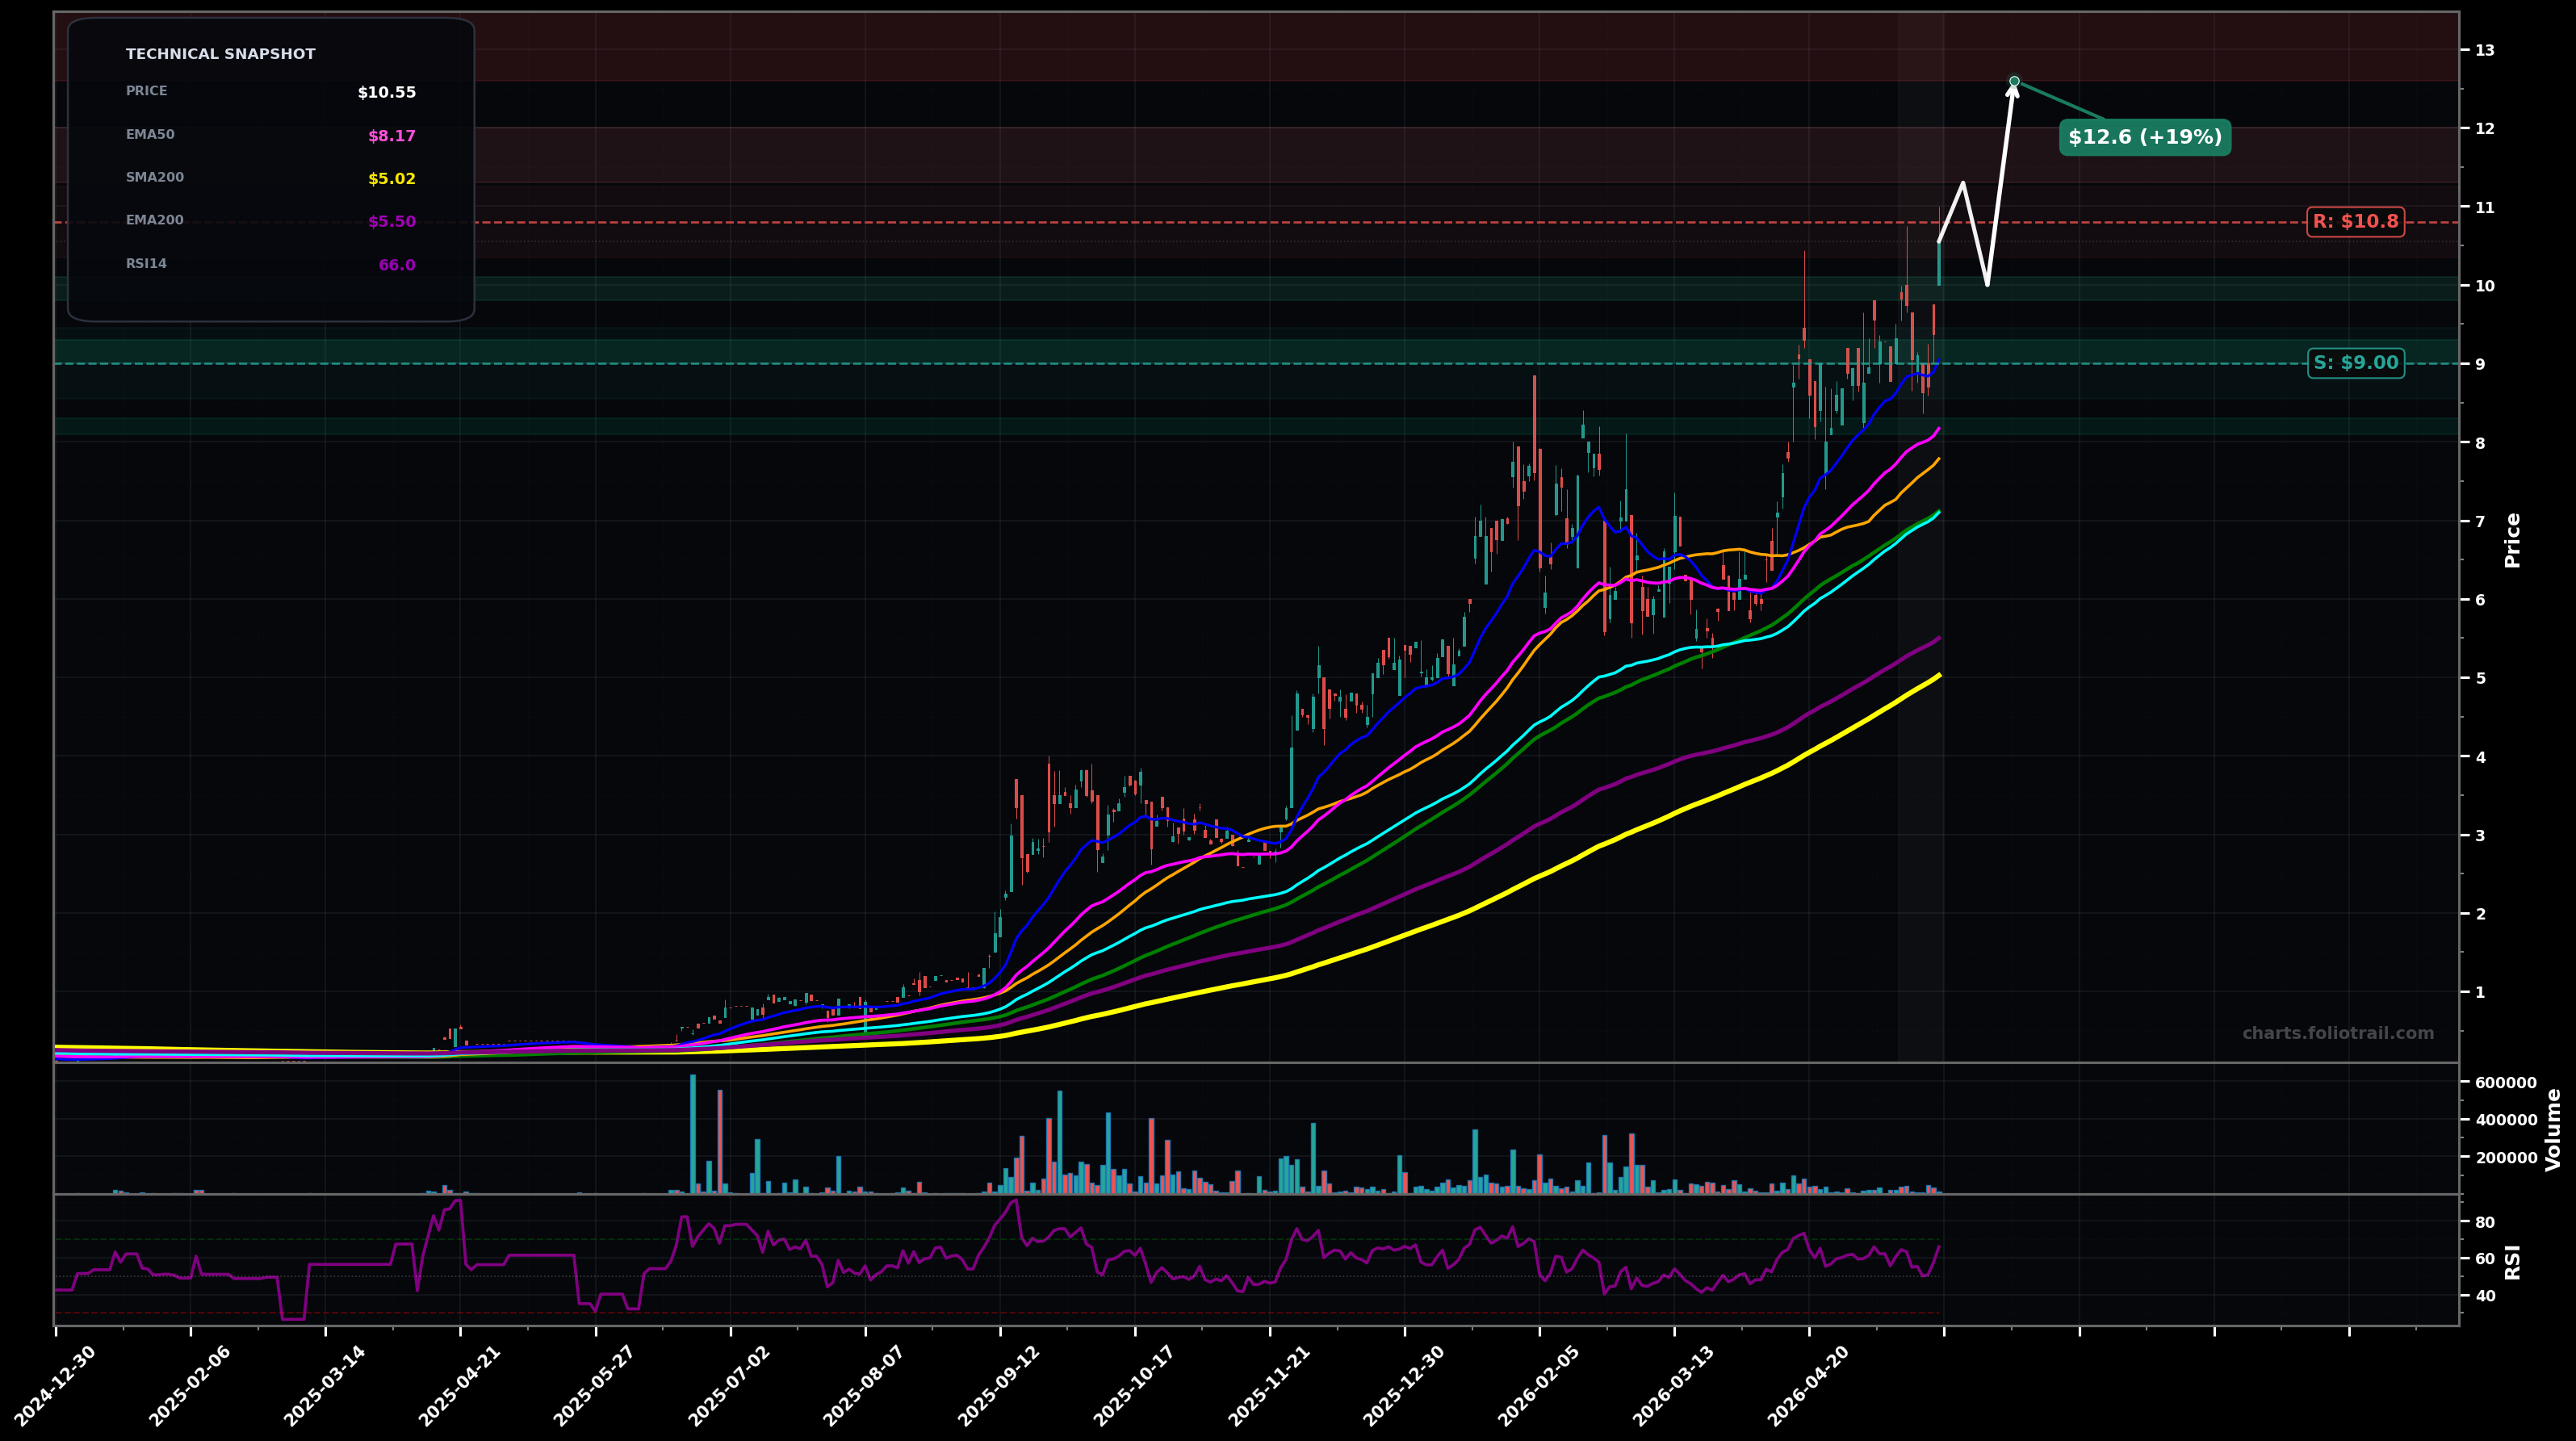
As of May 22, 2026, SREMF (Sunrise Energy Metals Limited) is in a uptrend state on the daily chart, with a confidence level of 78%. Key support is at $9.00 and key resistance at $10.8. Price at $10.55 is pushing to fresh highs after a sharp breakout; candles remain above all key EMAs/SMAs with RSI-14 ~66 (strong momentum, not extreme).
Bullish continuation: momentum holds, a brief pullback/retest of the breakout zone resolves higher; Elliott view: likely in an impulsive Wave 5 extension with shallow Wave 4-type dips.
Bearish consolidation/mean-reversion: volatility expands and price retraces toward rising averages (Wave 4 or post-W5 correction), then attempts to base.
Hold 2+ daily closes above $10.40
Daily close below $9.00 (loss of the most recent swing support/EMA20 area)
Scale on pullbacks to the breakout retest ($10 area), then primary swing support ($9) and finally EMA50 confluence (~$8.17) if a deeper Wave-4 style dip occurs.
Trim into upside extensions (likely fib/projection zones) as price stretches far above EMA50/EMA100; progressively de-risk if RSI/price go parabolic relative to the MA stack.
As of May 22, 2026, SREMF (Sunrise Energy Metals Limited) is in a uptrend state on the daily chart with 78% confidence. Price at $10.55 is pushing to fresh highs after a sharp breakout; candles remain above all key EMAs/SMAs with RSI-14 ~66 (strong momentum, not extreme).
On the daily timeframe, SREMF has key support at $9.00 and key resistance at $10.8. The most likely scenario (bullish) targets $11.3 and $12.6, with a revert level at $10.0.
SREMF (Sunrise Energy Metals Limited) is currently classified as uptrend on the daily chart, with 78% confidence. Confirmation requires: Hold 2+ daily closes above $10.40 This would be invalidated by: Daily close below $9.00 (loss of the most recent swing support/EMA20 area)
The most likely scenario (bullish) targets $11.3 and $12.6, with a revert level at $10.0. The alternative scenario (bearish) targets $9.00 and $8.20.
Multi-layer AI agents analyse 200+ stocks across daily, weekly, and monthly timeframes — producing market state classifications, price scenarios with targets, and position entry/exit levels. Daily charts updated every trading day at 6 PM ET. Weekly charts refresh Fridays. Monthly charts refresh on the last trading day of each month. No paywall. No sign-up required.
Built by Foliotrail.
All content on this website — including charts, analysis, price targets, support/resistance levels, and position zones — is generated entirely by AI and provided for educational and informational purposes only.
This is not financial advice. NEXUSNOIR VENTURES SL (the operator of this website) is not a registered investment adviser or broker-dealer. You should not make investment decisions based solely on this information. Always do your own research and consult a qualified financial advisor.
By continuing, you acknowledge that you have read and agree to our full disclaimer & terms of use and privacy policy.