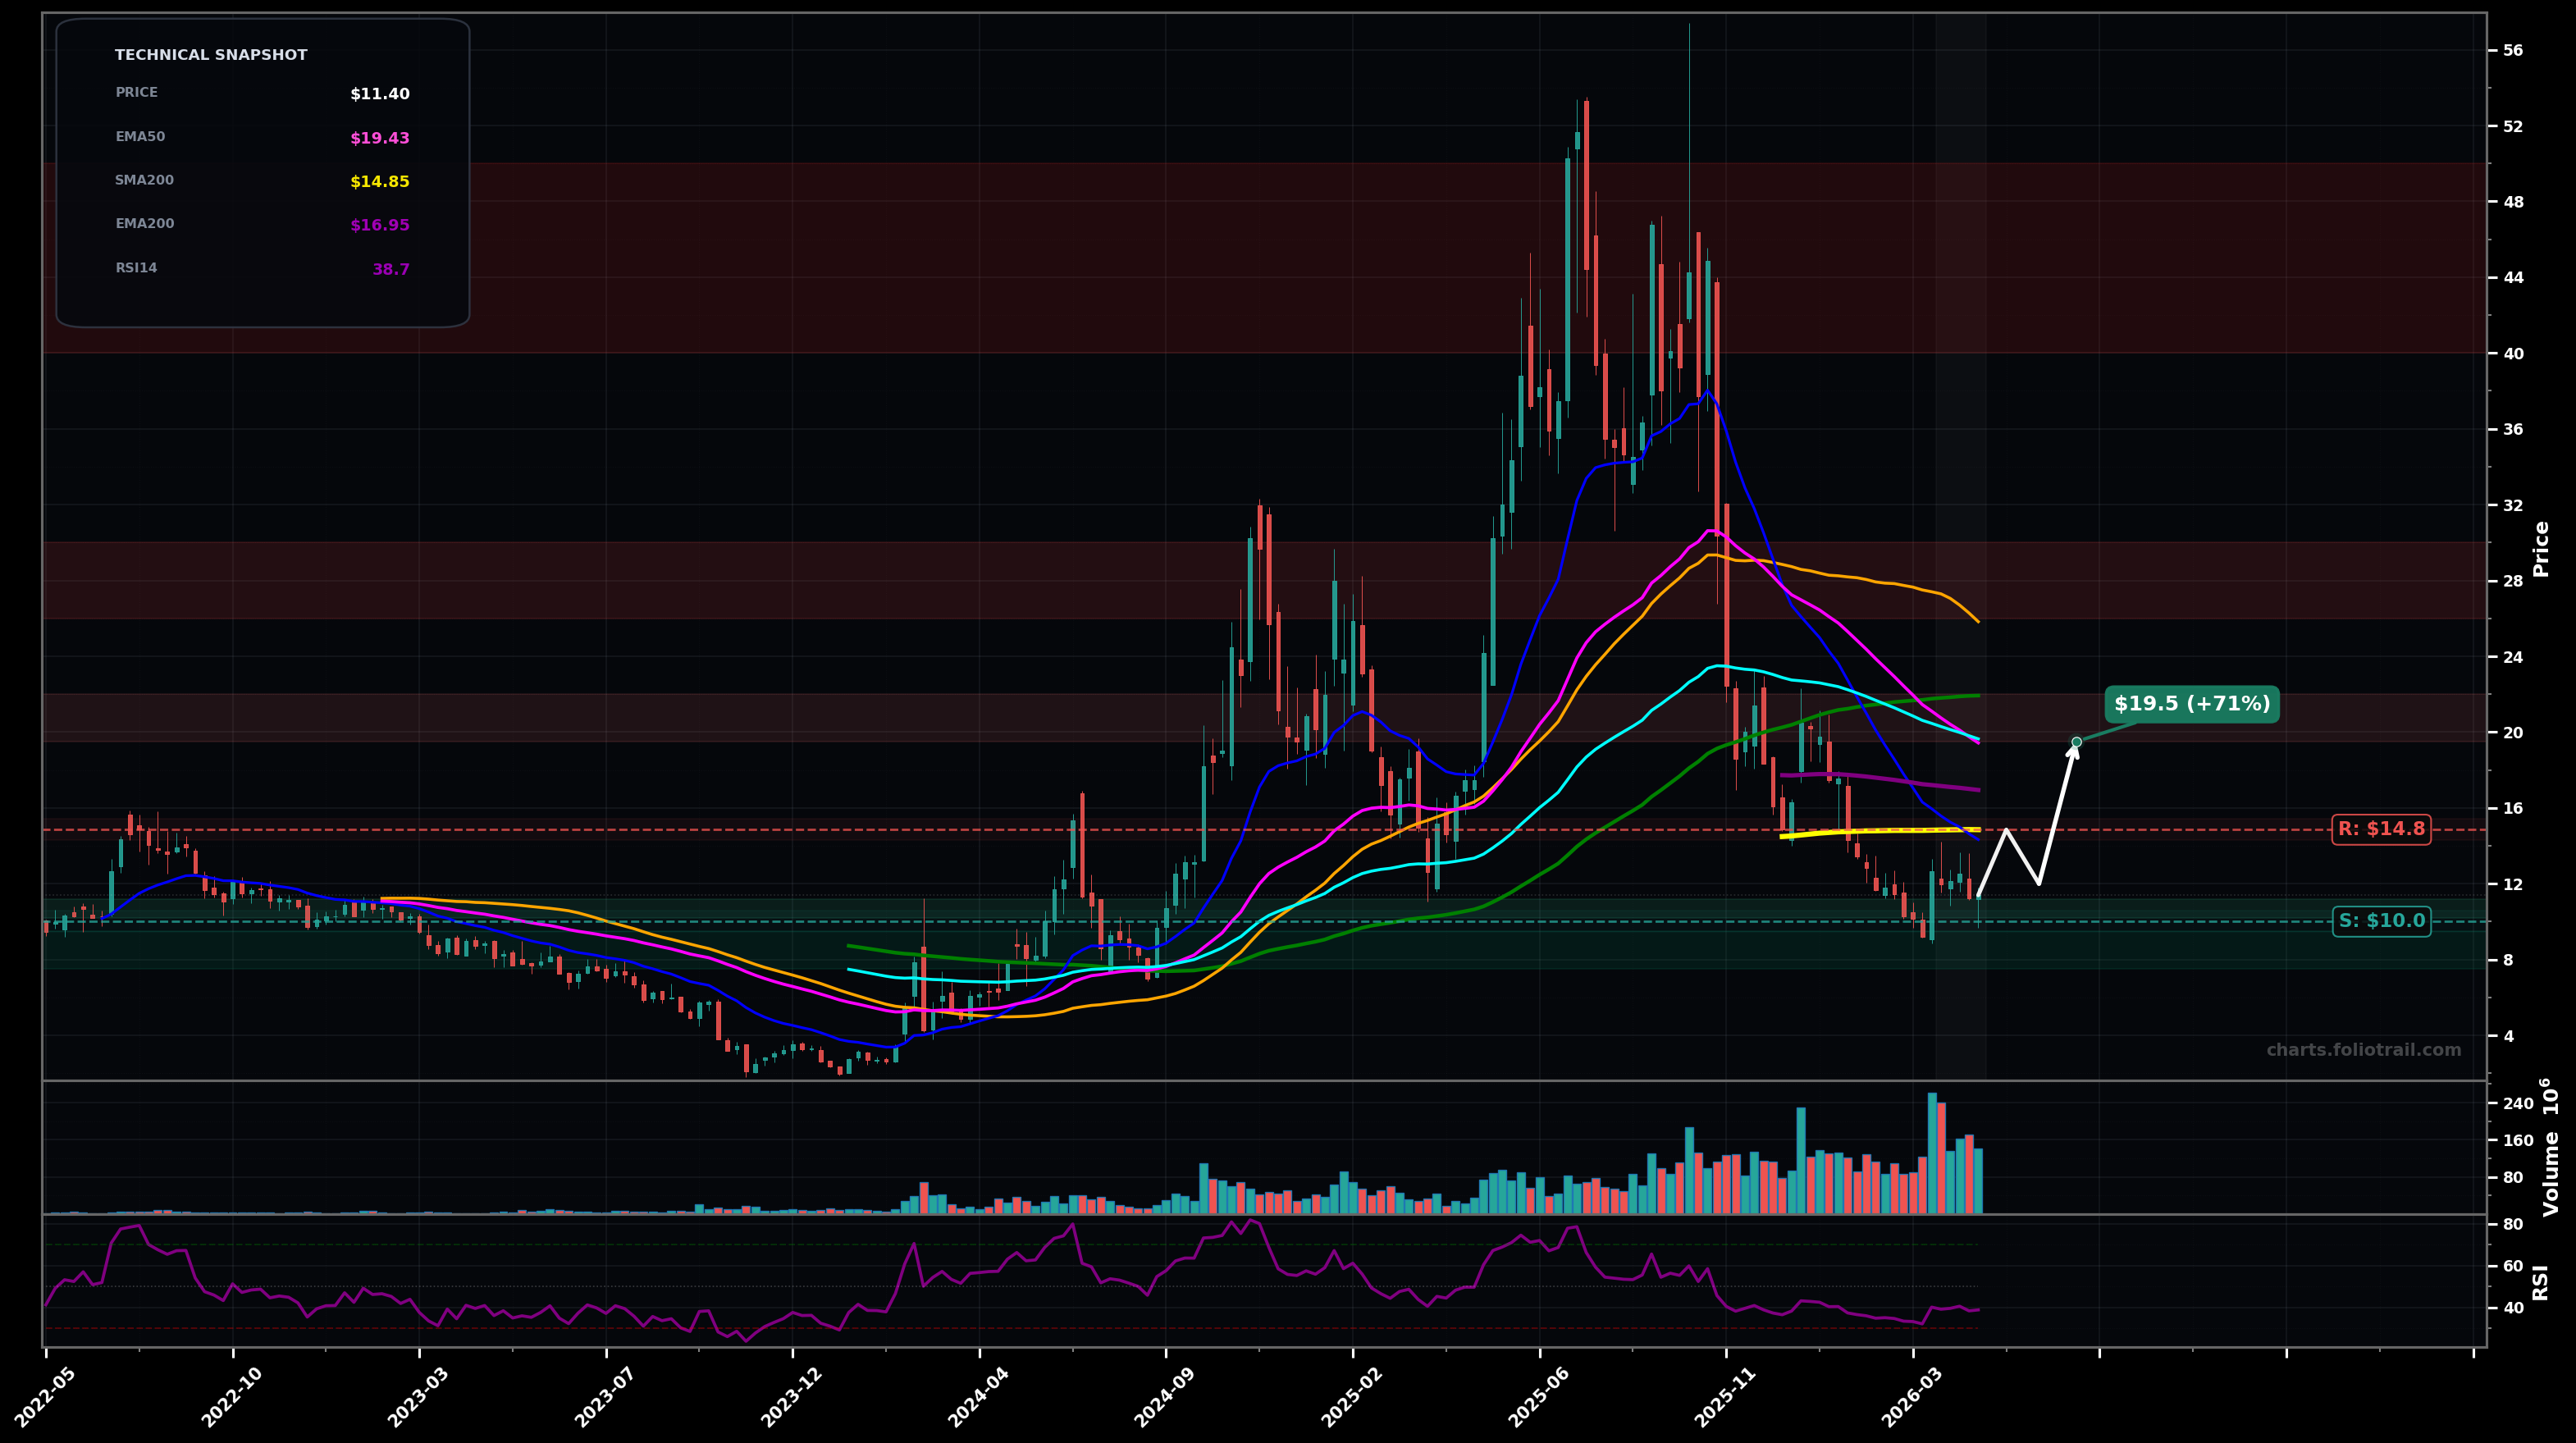
As of May 22, 2026, SMR (NuScale Power Corporation) is in a bottoming attempt state on the weekly chart, with a confidence level of 62%. Key support is at $10.0 and key resistance at $14.8. Price at ~$11.40 after a sharp selloff from the ~$40–$50 area; weekly candles are basing with small rebounds but still making LHs under declining fast MAs (RSI ~39).
Base continues between ~$10 and ~$14.85, then a breakout-reclaim of the long-term ~$14.85 area leads to a mean-reversion push toward the falling EMA200 and then EMA50/EMA100 cluster.
Support fails and the downtrend resumes; breakdown below ~$10 triggers a liquidity sweep toward the prior swing low, with risk of extension if volume expands on red weeks.
Weekly close back above ~$14.85 (SMA200) and holding for 2+ closes
Weekly close below ~$9.50 (recent swing low zone)
Scale-in around the current base support (~$10–$11) and the swing-low ($9.5); deploy heavier only on capitulation toward deeper Fib retrace/previous demand ($7.5–$9.5).
Trim into MA mean-reversion (EMA50/100 area ~$19–$22), then into prior distribution/supply near SMA50/SMA100 (~$26–$30), and fully exit into the prior blow-off top supply (~$40–$50).
As of May 22, 2026, SMR (NuScale Power Corporation) is in a bottoming attempt state on the weekly chart with 62% confidence. Price at ~$11.40 after a sharp selloff from the ~$40–$50 area; weekly candles are basing with small rebounds but still making LHs under declining fast MAs (RSI ~39).
On the weekly timeframe, SMR has key support at $10.0 and key resistance at $14.8. The most likely scenario (bullish) targets $14.8 and $19.5, with a revert level at $12.0.
SMR (NuScale Power Corporation) is currently classified as bottoming attempt on the weekly chart, with 62% confidence. Confirmation requires: Weekly close back above ~$14.85 (SMA200) and holding for 2+ closes This would be invalidated by: Weekly close below ~$9.50 (recent swing low zone)
The most likely scenario (bullish) targets $14.8 and $19.5, with a revert level at $12.0. The alternative scenario (bearish) targets $9.50 and $7.50.
Multi-layer AI agents analyse 200+ stocks across daily, weekly, and monthly timeframes — producing market state classifications, price scenarios with targets, and position entry/exit levels. Daily charts updated every trading day at 6 PM ET. Weekly charts refresh Fridays. Monthly charts refresh on the last trading day of each month. No paywall. No sign-up required.
Built by Foliotrail.
All content on this website — including charts, analysis, price targets, support/resistance levels, and position zones — is generated entirely by AI and provided for educational and informational purposes only.
This is not financial advice. NEXUSNOIR VENTURES SL (the operator of this website) is not a registered investment adviser or broker-dealer. You should not make investment decisions based solely on this information. Always do your own research and consult a qualified financial advisor.
By continuing, you acknowledge that you have read and agree to our full disclaimer & terms of use and privacy policy.