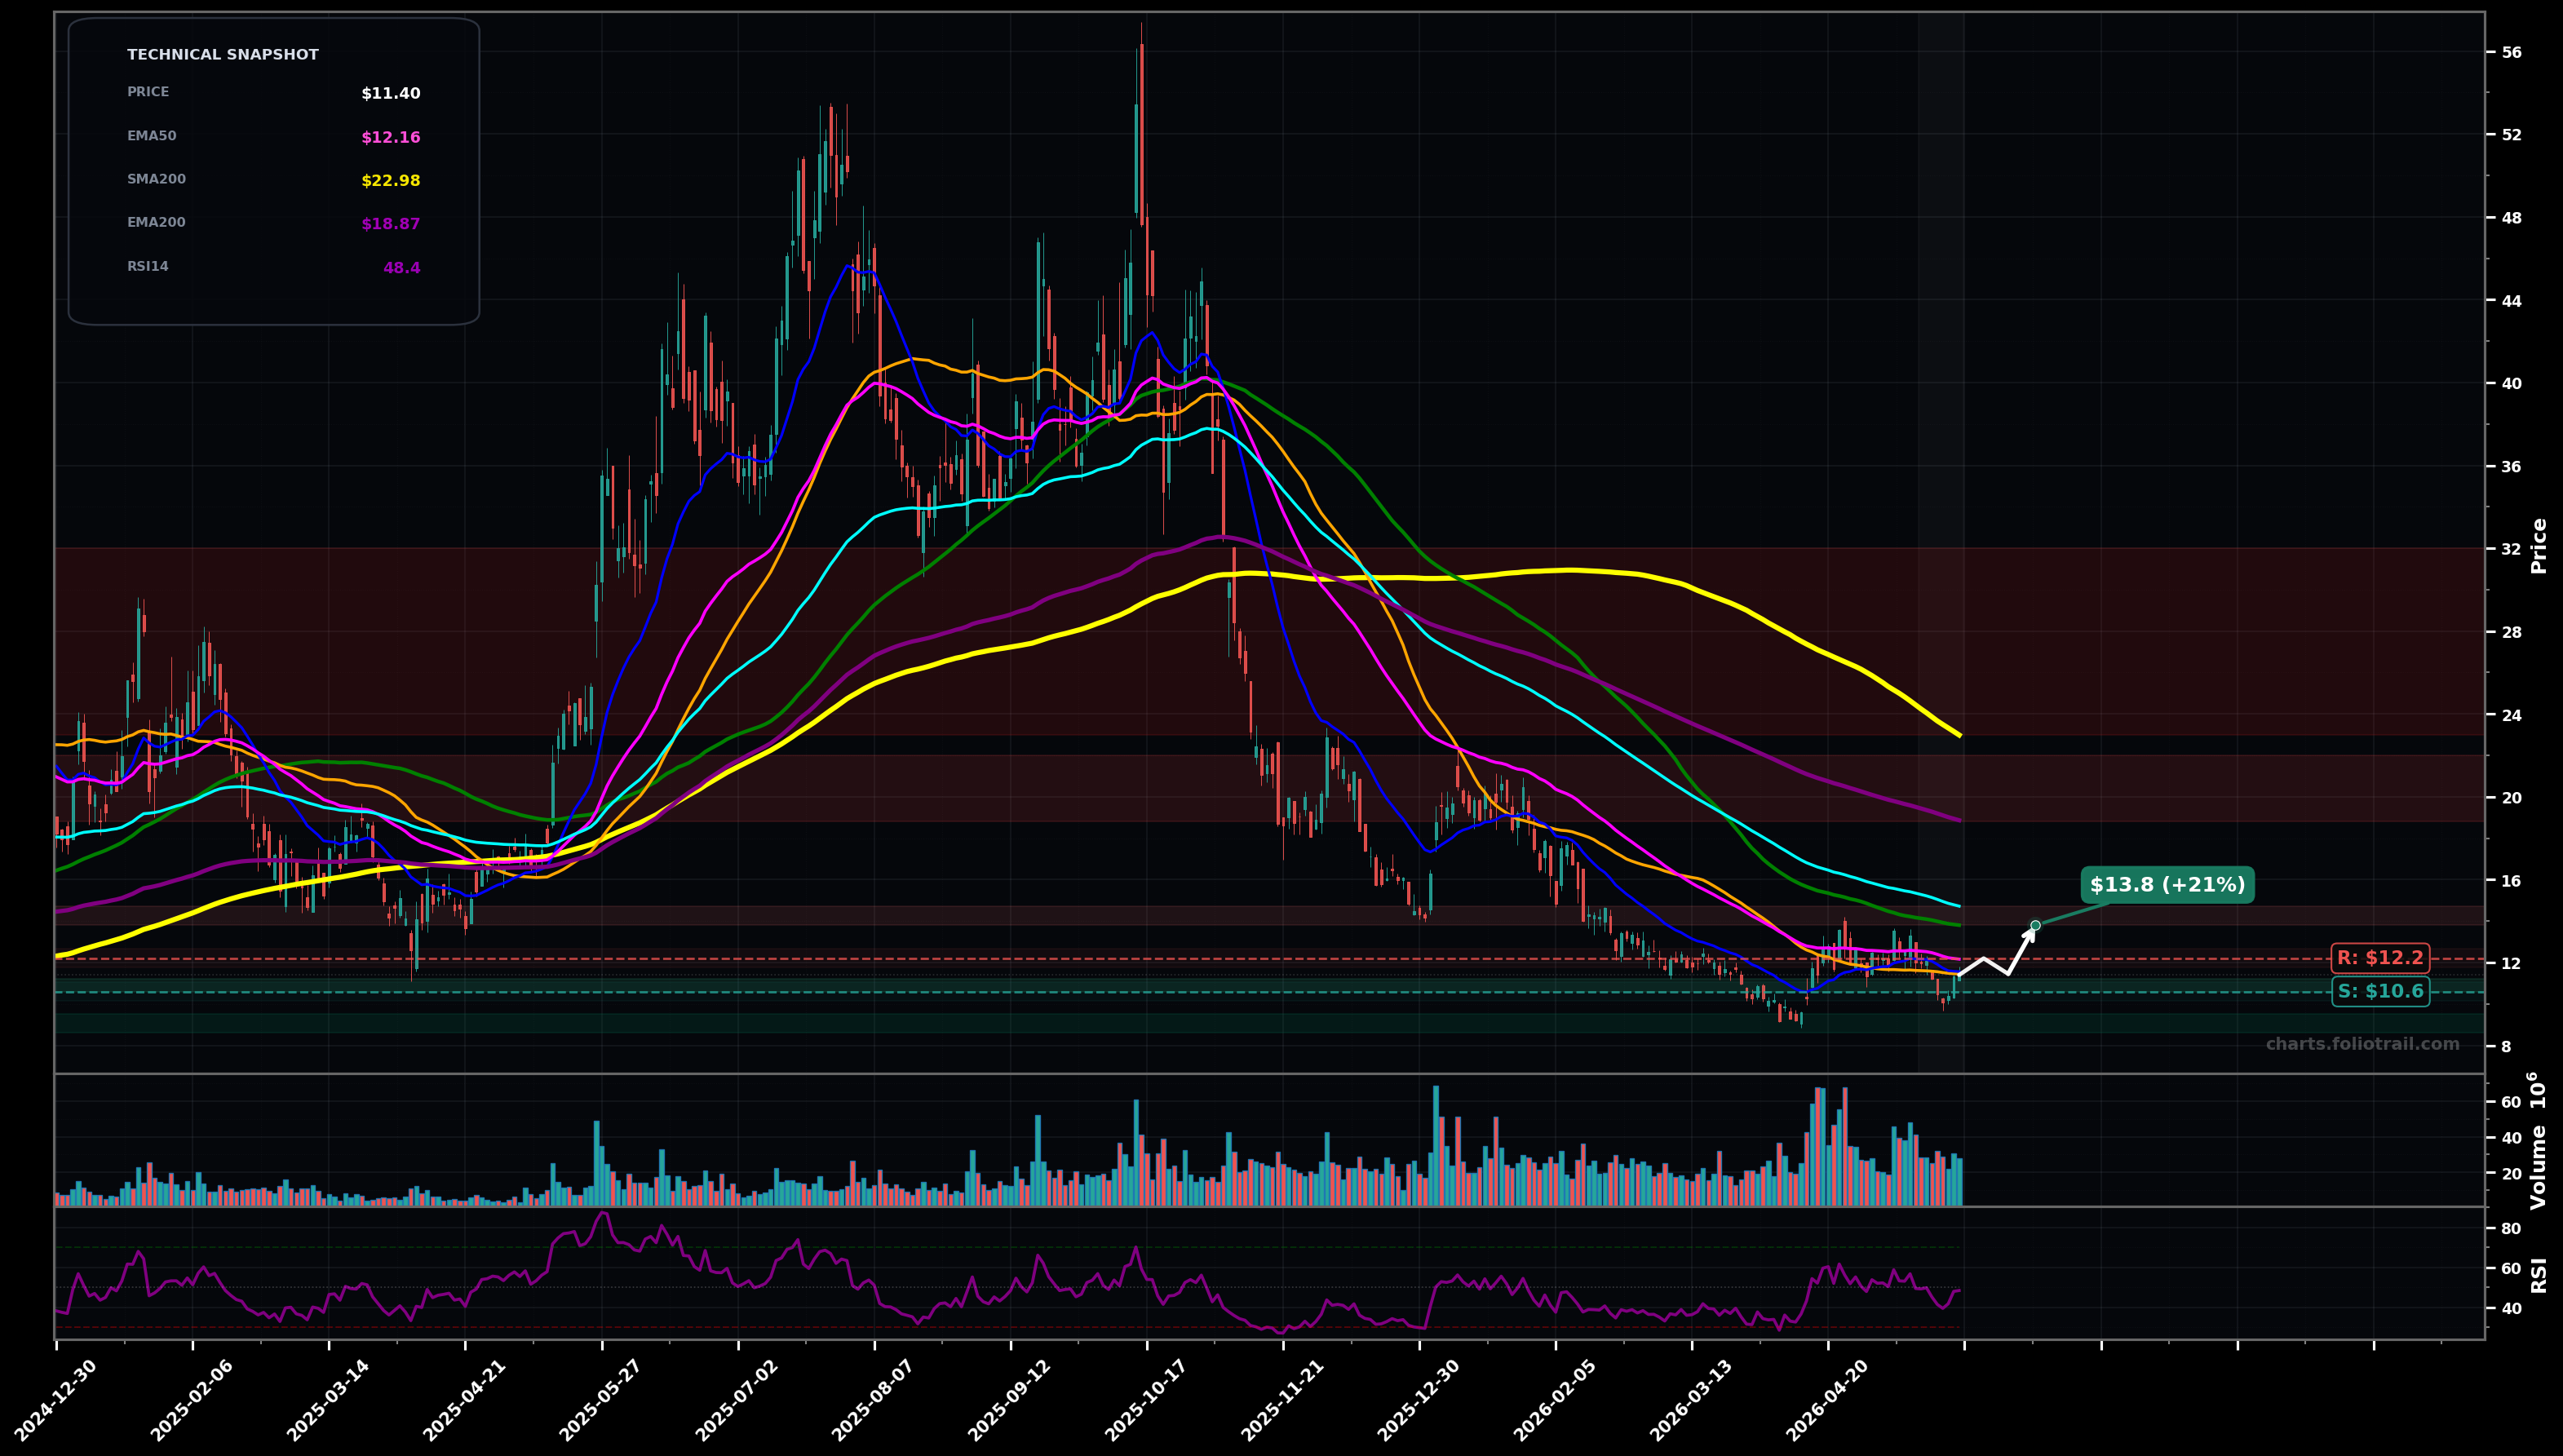
As of May 22, 2026, SMR (NuScale Power Corporation) is in a bottoming attempt state on the daily chart, with a confidence level of 62%. Key support is at $10.6 and key resistance at $12.2. Price at ~$11.40 is basing after a long selloff, holding above recent lows while still below falling EMA50/EMA100; RSI ~48 suggests neutral/repairing momentum.
Base-building continues between ~$10.60–$12.20, then a breakout/reclaim of EMA50 leads to a grind toward the next moving-average cluster (mean reversion leg).
Failure of the base with a breakdown under recent pivot support triggers another liquidation leg (likely wave-5/continuation), probing lower fib extension levels before any durable reversal.
2+ daily closes back above EMA50 around ~$12.20 (ideally reclaiming SMA50 ~$11.45 and holding).
Daily close below the swing-low support around ~$10.60.
Start near the swing-low support; add on breakdown/flush into next demand; heavy add only on capitulation-style extension (better R:R) while trend MAs remain bearish.
Trim into mean-reversion toward SMA100/EMA100 first, then larger trims into EMA200/SMA200 overhead supply; fully exit only if a multi-year stretched move revisits prior major MA zone/structure.
As of May 22, 2026, SMR (NuScale Power Corporation) is in a bottoming attempt state on the daily chart with 62% confidence. Price at ~$11.40 is basing after a long selloff, holding above recent lows while still below falling EMA50/EMA100; RSI ~48 suggests neutral/repairing momentum.
On the daily timeframe, SMR has key support at $10.6 and key resistance at $12.2. The most likely scenario (bullish) targets $12.2 and $13.8, with a revert level at $11.4.
SMR (NuScale Power Corporation) is currently classified as bottoming attempt on the daily chart, with 62% confidence. Confirmation requires: 2+ daily closes back above EMA50 around ~$12.20 (ideally reclaiming SMA50 ~$11.45 and holding). This would be invalidated by: Daily close below the swing-low support around ~$10.60.
The most likely scenario (bullish) targets $12.2 and $13.8, with a revert level at $11.4. The alternative scenario (bearish) targets $10.6 and $9.50.
Multi-layer AI agents analyse 200+ stocks across daily, weekly, and monthly timeframes — producing market state classifications, price scenarios with targets, and position entry/exit levels. Daily charts updated every trading day at 6 PM ET. Weekly charts refresh Fridays. Monthly charts refresh on the last trading day of each month. No paywall. No sign-up required.
Built by Foliotrail.
All content on this website — including charts, analysis, price targets, support/resistance levels, and position zones — is generated entirely by AI and provided for educational and informational purposes only.
This is not financial advice. NEXUSNOIR VENTURES SL (the operator of this website) is not a registered investment adviser or broker-dealer. You should not make investment decisions based solely on this information. Always do your own research and consult a qualified financial advisor.
By continuing, you acknowledge that you have read and agree to our full disclaimer & terms of use and privacy policy.