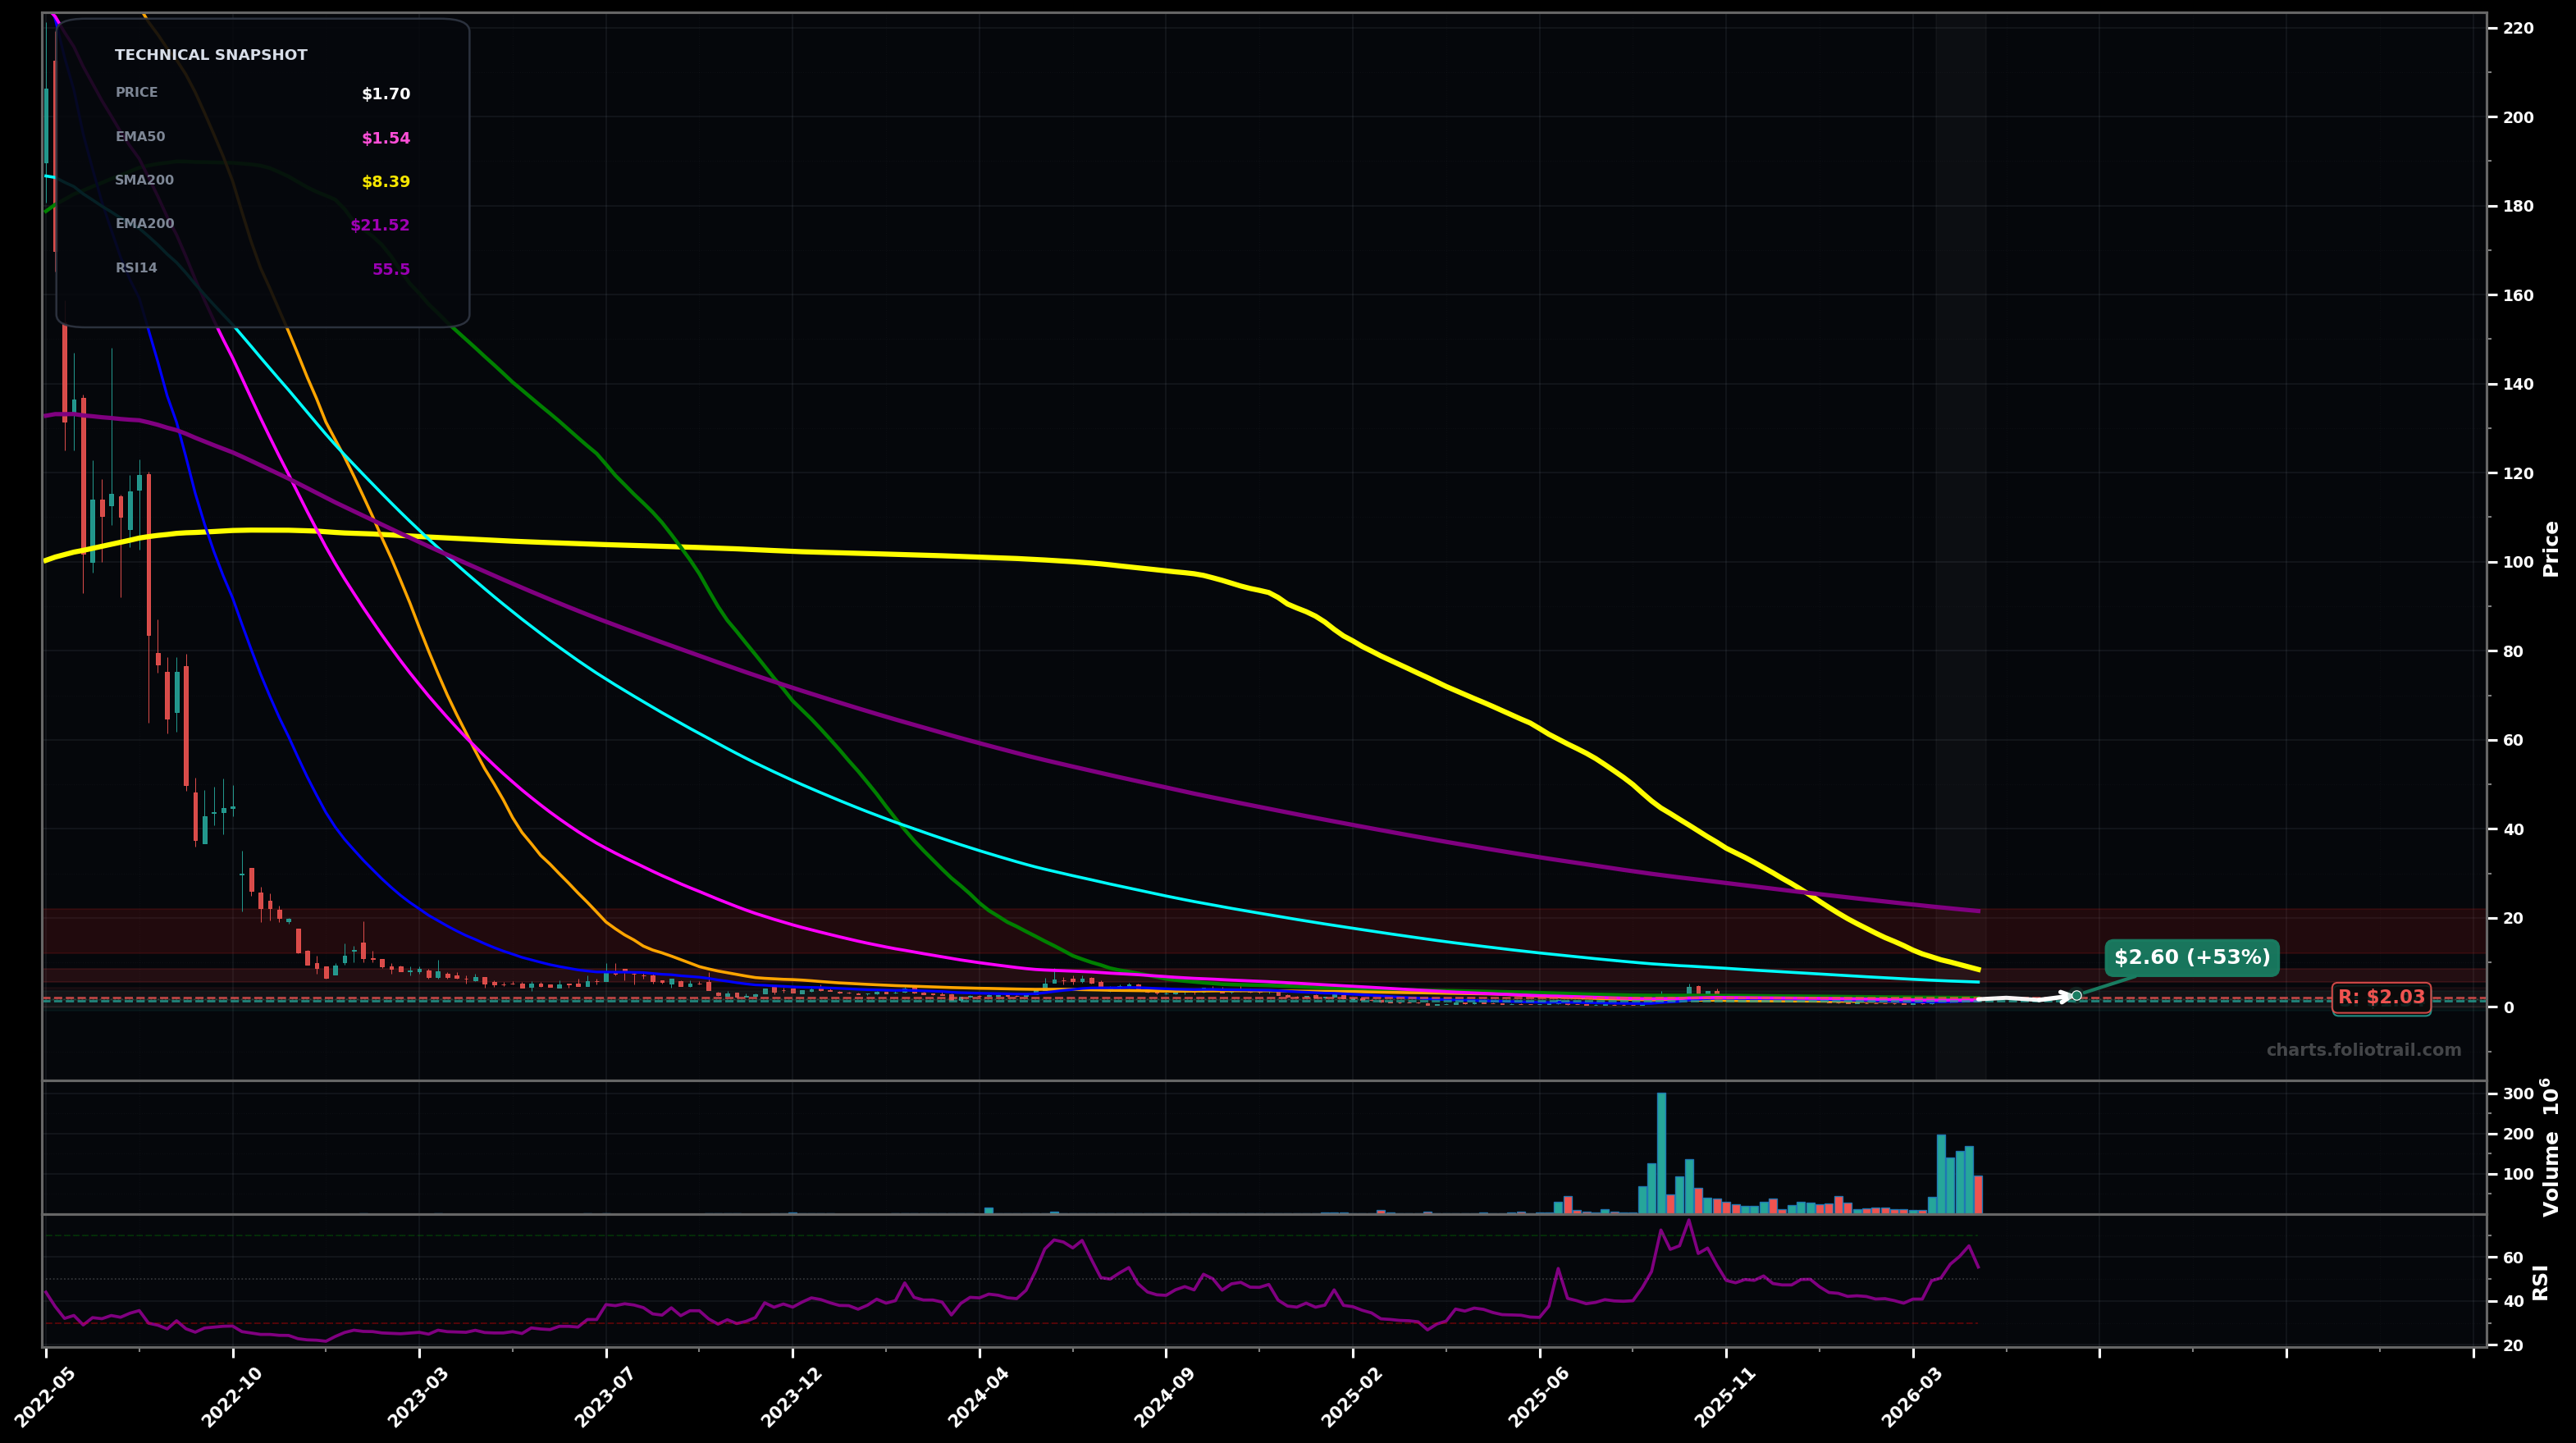
As of May 22, 2026, SLNH (Soluna Holdings Inc.) is in a bottoming attempt state on the weekly chart, with a confidence level of 58%. Key support is at $1.34 and key resistance at $2.03. Price at ~$1.70 after a sharp volume-backed bounce, now holding above the short MAs (SMA50/EMA20) but still far below the long-term averages (EMA100/200, SMA100/200).
Base-building continues and price grinds higher; a pullback retests $1.54–$1.34, then attempts a breakout through $2.03 and runs toward the next MA cluster.
Failed breakout: price rejects at/under $2.03, rolls over, and breaks back into the base; momentum fades and retests the prior demand zone near $1.00.
Weekly close above $2.05 (reclaim/hold over SMA100 ~$2.03 area) for 2+ weeks
Weekly close below $1.34 (loss of SMA50/EMA20 area) shifts back toward bearish control
Start near reclaimed short-MA support ($1.54 area), add on a deeper pullback into main support ($1.34), heavy add only on a full retest/undercut of the base demand near ~$1.00.
Trim into mean-reversion rallies toward higher MAs (EMA100 ~$5.57, EMA200 ~$21.52) and major prior distribution zones; fully exit if price gets extremely stretched back toward long-term averages.
As of May 22, 2026, SLNH (Soluna Holdings Inc.) is in a bottoming attempt state on the weekly chart with 58% confidence. Price at ~$1.70 after a sharp volume-backed bounce, now holding above the short MAs (SMA50/EMA20) but still far below the long-term averages (EMA100/200, SMA100/200).
On the weekly timeframe, SLNH has key support at $1.34 and key resistance at $2.03. The most likely scenario (bullish) targets $2.03 and $2.60, with a revert level at $1.54.
SLNH (Soluna Holdings Inc.) is currently classified as bottoming attempt on the weekly chart, with 58% confidence. Confirmation requires: Weekly close above $2.05 (reclaim/hold over SMA100 ~$2.03 area) for 2+ weeks This would be invalidated by: Weekly close below $1.34 (loss of SMA50/EMA20 area) shifts back toward bearish control
The most likely scenario (bullish) targets $2.03 and $2.60, with a revert level at $1.54. The alternative scenario (bearish) targets $1.34 and $1.00.
Multi-layer AI agents analyse 200+ stocks across daily, weekly, and monthly timeframes — producing market state classifications, price scenarios with targets, and position entry/exit levels. Daily charts updated every trading day at 6 PM ET. Weekly charts refresh Fridays. Monthly charts refresh on the last trading day of each month. No paywall. No sign-up required.
Built by Foliotrail.
All content on this website — including charts, analysis, price targets, support/resistance levels, and position zones — is generated entirely by AI and provided for educational and informational purposes only.
This is not financial advice. NEXUSNOIR VENTURES SL (the operator of this website) is not a registered investment adviser or broker-dealer. You should not make investment decisions based solely on this information. Always do your own research and consult a qualified financial advisor.
By continuing, you acknowledge that you have read and agree to our full disclaimer & terms of use and privacy policy.