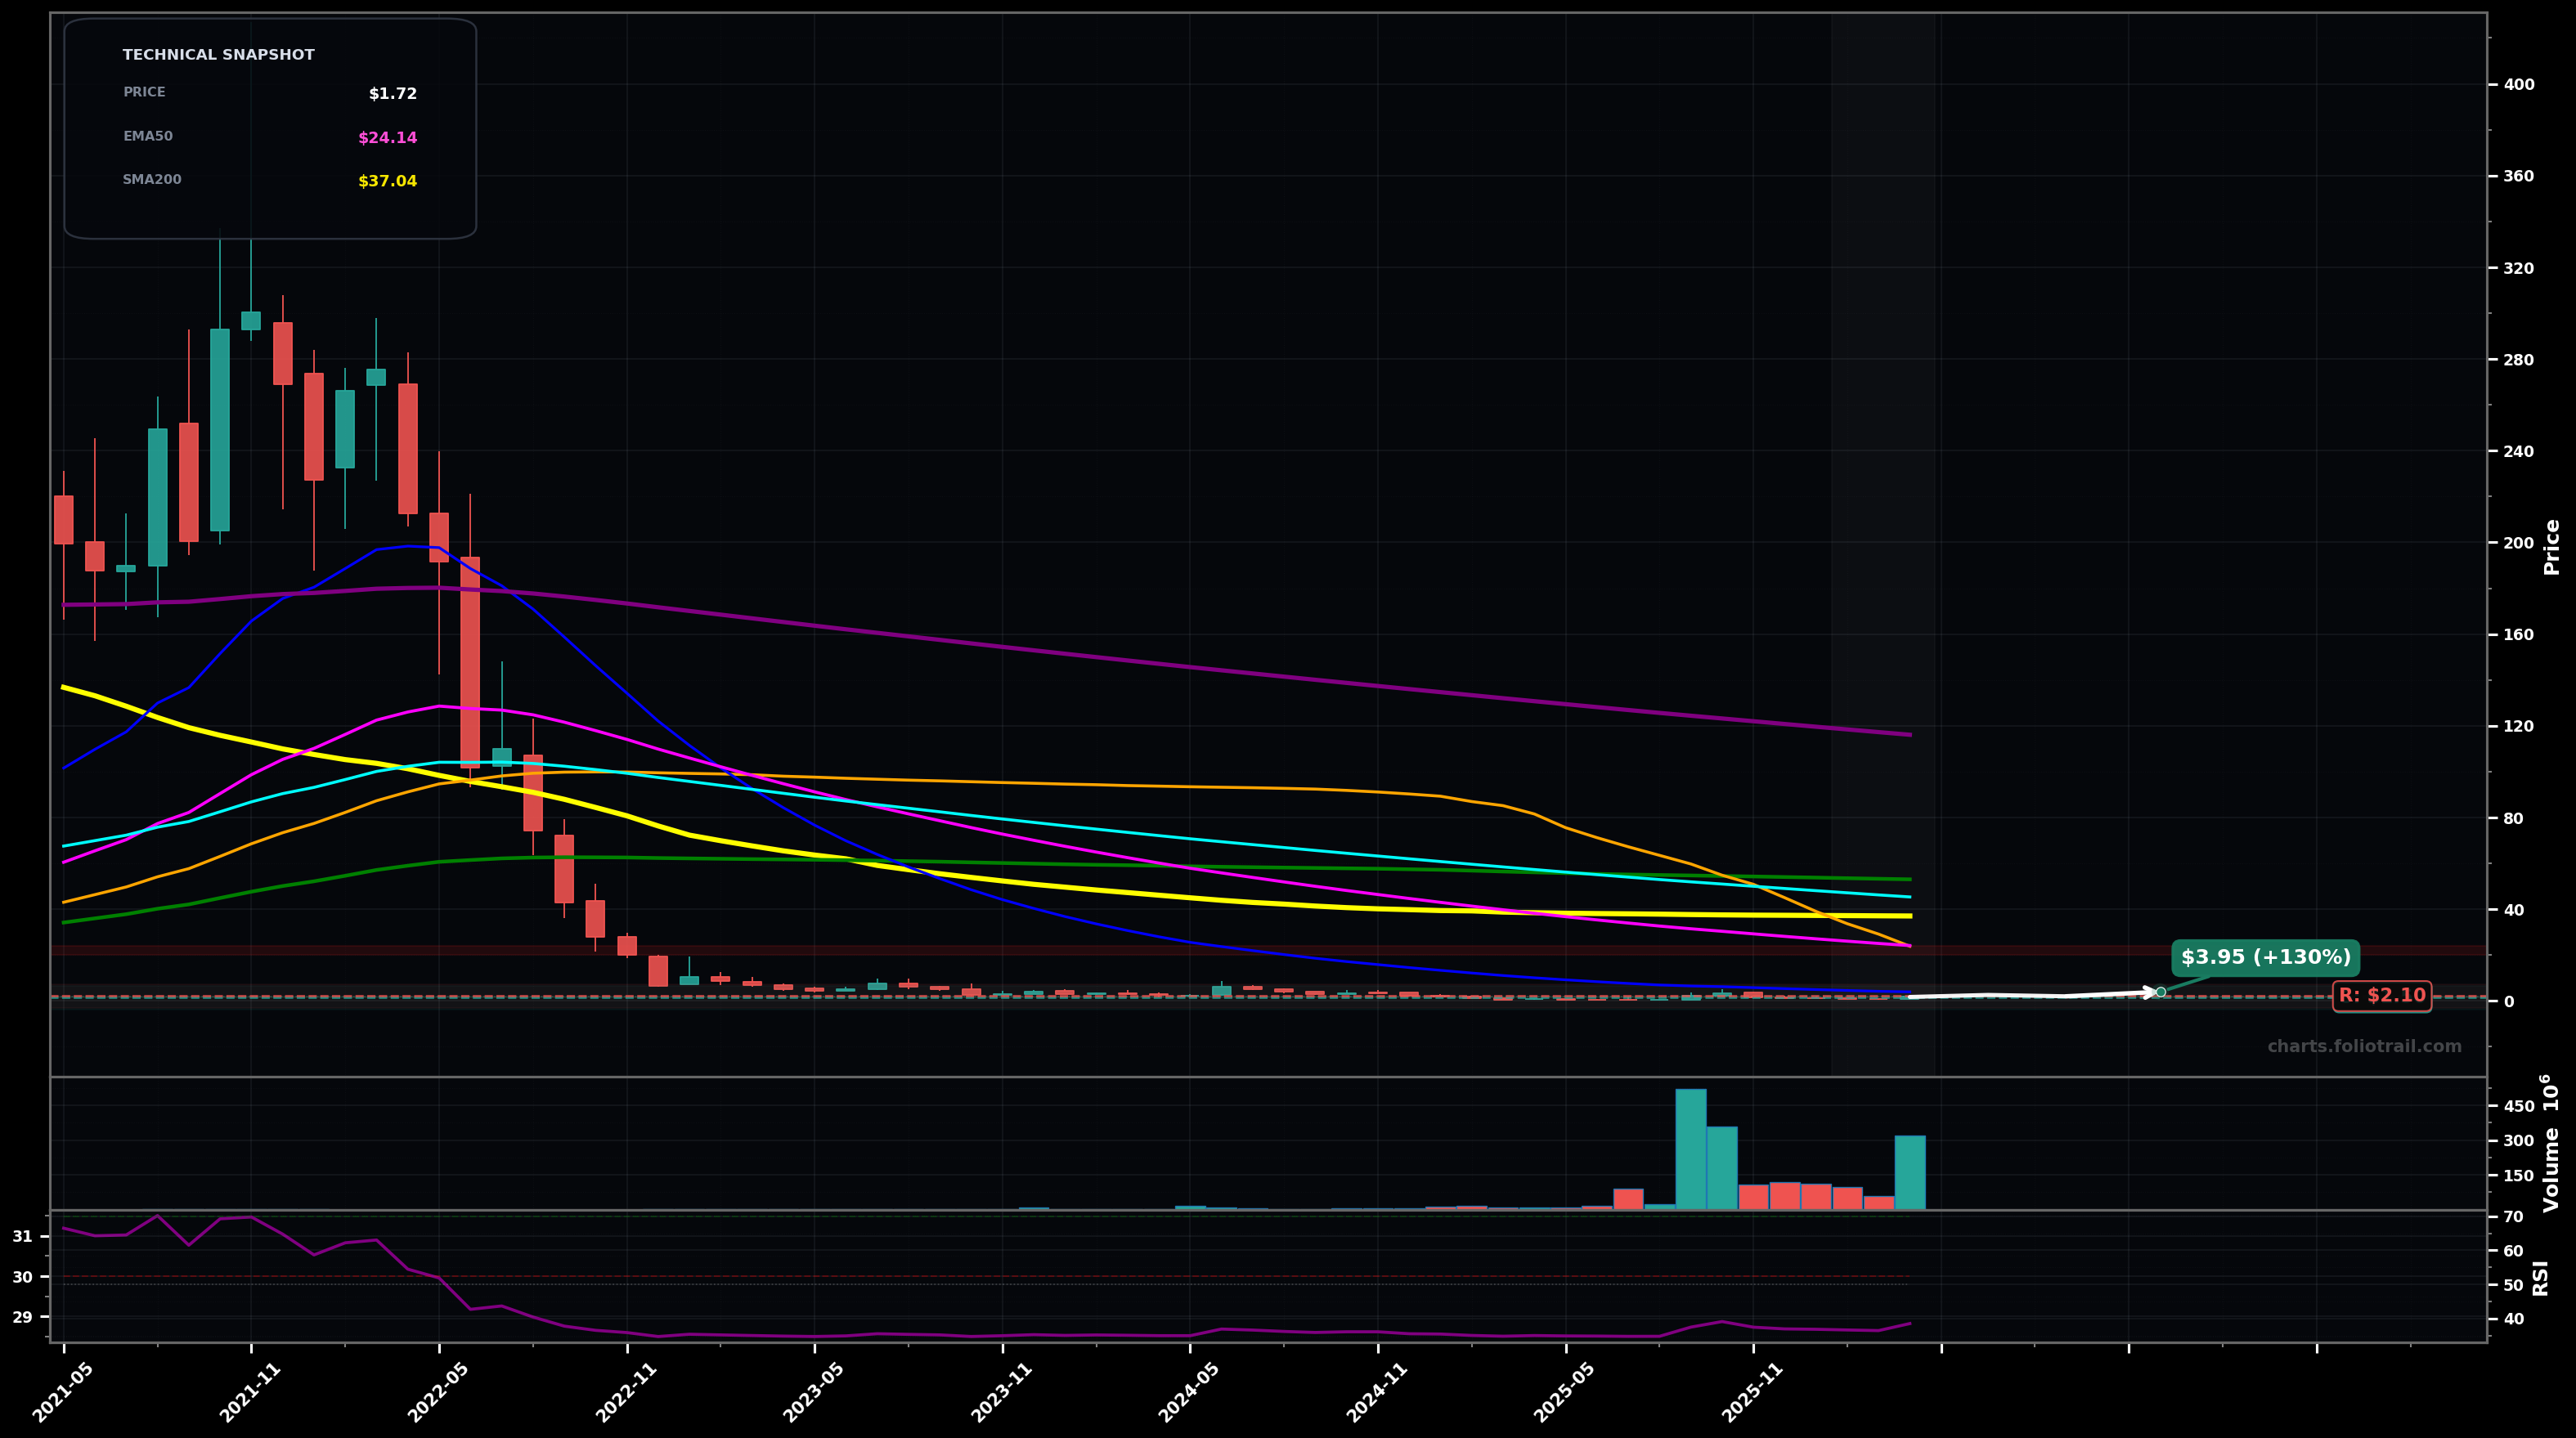
As of April 30, 2026, SLNH (Soluna Holdings Inc.) is in a bottoming attempt state on the monthly chart, with a confidence level of 62%. Key support is at $1.50 and key resistance at $2.10. Price is ~$1.72 after a long multi-year collapse; recent months show tight, low-price basing with a couple of higher-volume green candles but still far below all major MAs; RSI-14 ~38.5 (weak rebound from oversold).
Base-building continues: price chops between ~$1.50–$2.10, then attempts a breakout; if it clears ~$2.10, next it likely mean-reverts toward the nearest short-term MA cluster/overhead supply.
Failed base: a rollover from ~$2.00–$2.10 rejects and breaks the base floor, leading to a liquidity-driven flush to new lows before any sustainable reversal.
Monthly close above ~$2.10 and then a second close holding above ~$2.00 (HH/HL attempt becomes visible).
Monthly close below ~$1.40 (loss of the recent base floor implies renewed breakdown risk).
Entries are staged around the visible base floor (~$1.50), then prior-wick/psych support and potential capitulation zone; trend is still below EMA50/100 so size conservatively until a reclaim >$2.10.
Trim into large overhead supply/mean-reversion levels: ~$3.95 aligns with EMA20 area, higher trims assume a larger Elliott corrective rally toward broken prior ranges; full close only if a multi-year squeeze reaches extreme upside extension.
As of April 30, 2026, SLNH (Soluna Holdings Inc.) is in a bottoming attempt state on the monthly chart with 62% confidence. Price is ~$1.72 after a long multi-year collapse; recent months show tight, low-price basing with a couple of higher-volume green candles but still far below all major MAs; RSI-14 ~38.5 (weak rebound from oversold).
On the monthly timeframe, SLNH has key support at $1.50 and key resistance at $2.10. The most likely scenario (bullish) targets $2.60 and $3.95, with a revert level at $2.00.
SLNH (Soluna Holdings Inc.) is currently classified as bottoming attempt on the monthly chart, with 62% confidence. Confirmation requires: Monthly close above ~$2.10 and then a second close holding above ~$2.00 (HH/HL attempt becomes visible). This would be invalidated by: Monthly close below ~$1.40 (loss of the recent base floor implies renewed breakdown risk).
The most likely scenario (bullish) targets $2.60 and $3.95, with a revert level at $2.00. The alternative scenario (bearish) targets $1.20 and $0.80.
Multi-layer AI agents analyse 200+ stocks across daily, weekly, and monthly timeframes — producing market state classifications, price scenarios with targets, and position entry/exit levels. Daily charts updated every trading day at 6 PM ET. Weekly charts refresh Fridays. Monthly charts refresh on the last trading day of each month. No paywall. No sign-up required.
Built by Foliotrail.
All content on this website — including charts, analysis, price targets, support/resistance levels, and position zones — is generated entirely by AI and provided for educational and informational purposes only.
This is not financial advice. NEXUSNOIR VENTURES SL (the operator of this website) is not a registered investment adviser or broker-dealer. You should not make investment decisions based solely on this information. Always do your own research and consult a qualified financial advisor.
By continuing, you acknowledge that you have read and agree to our full disclaimer & terms of use and privacy policy.