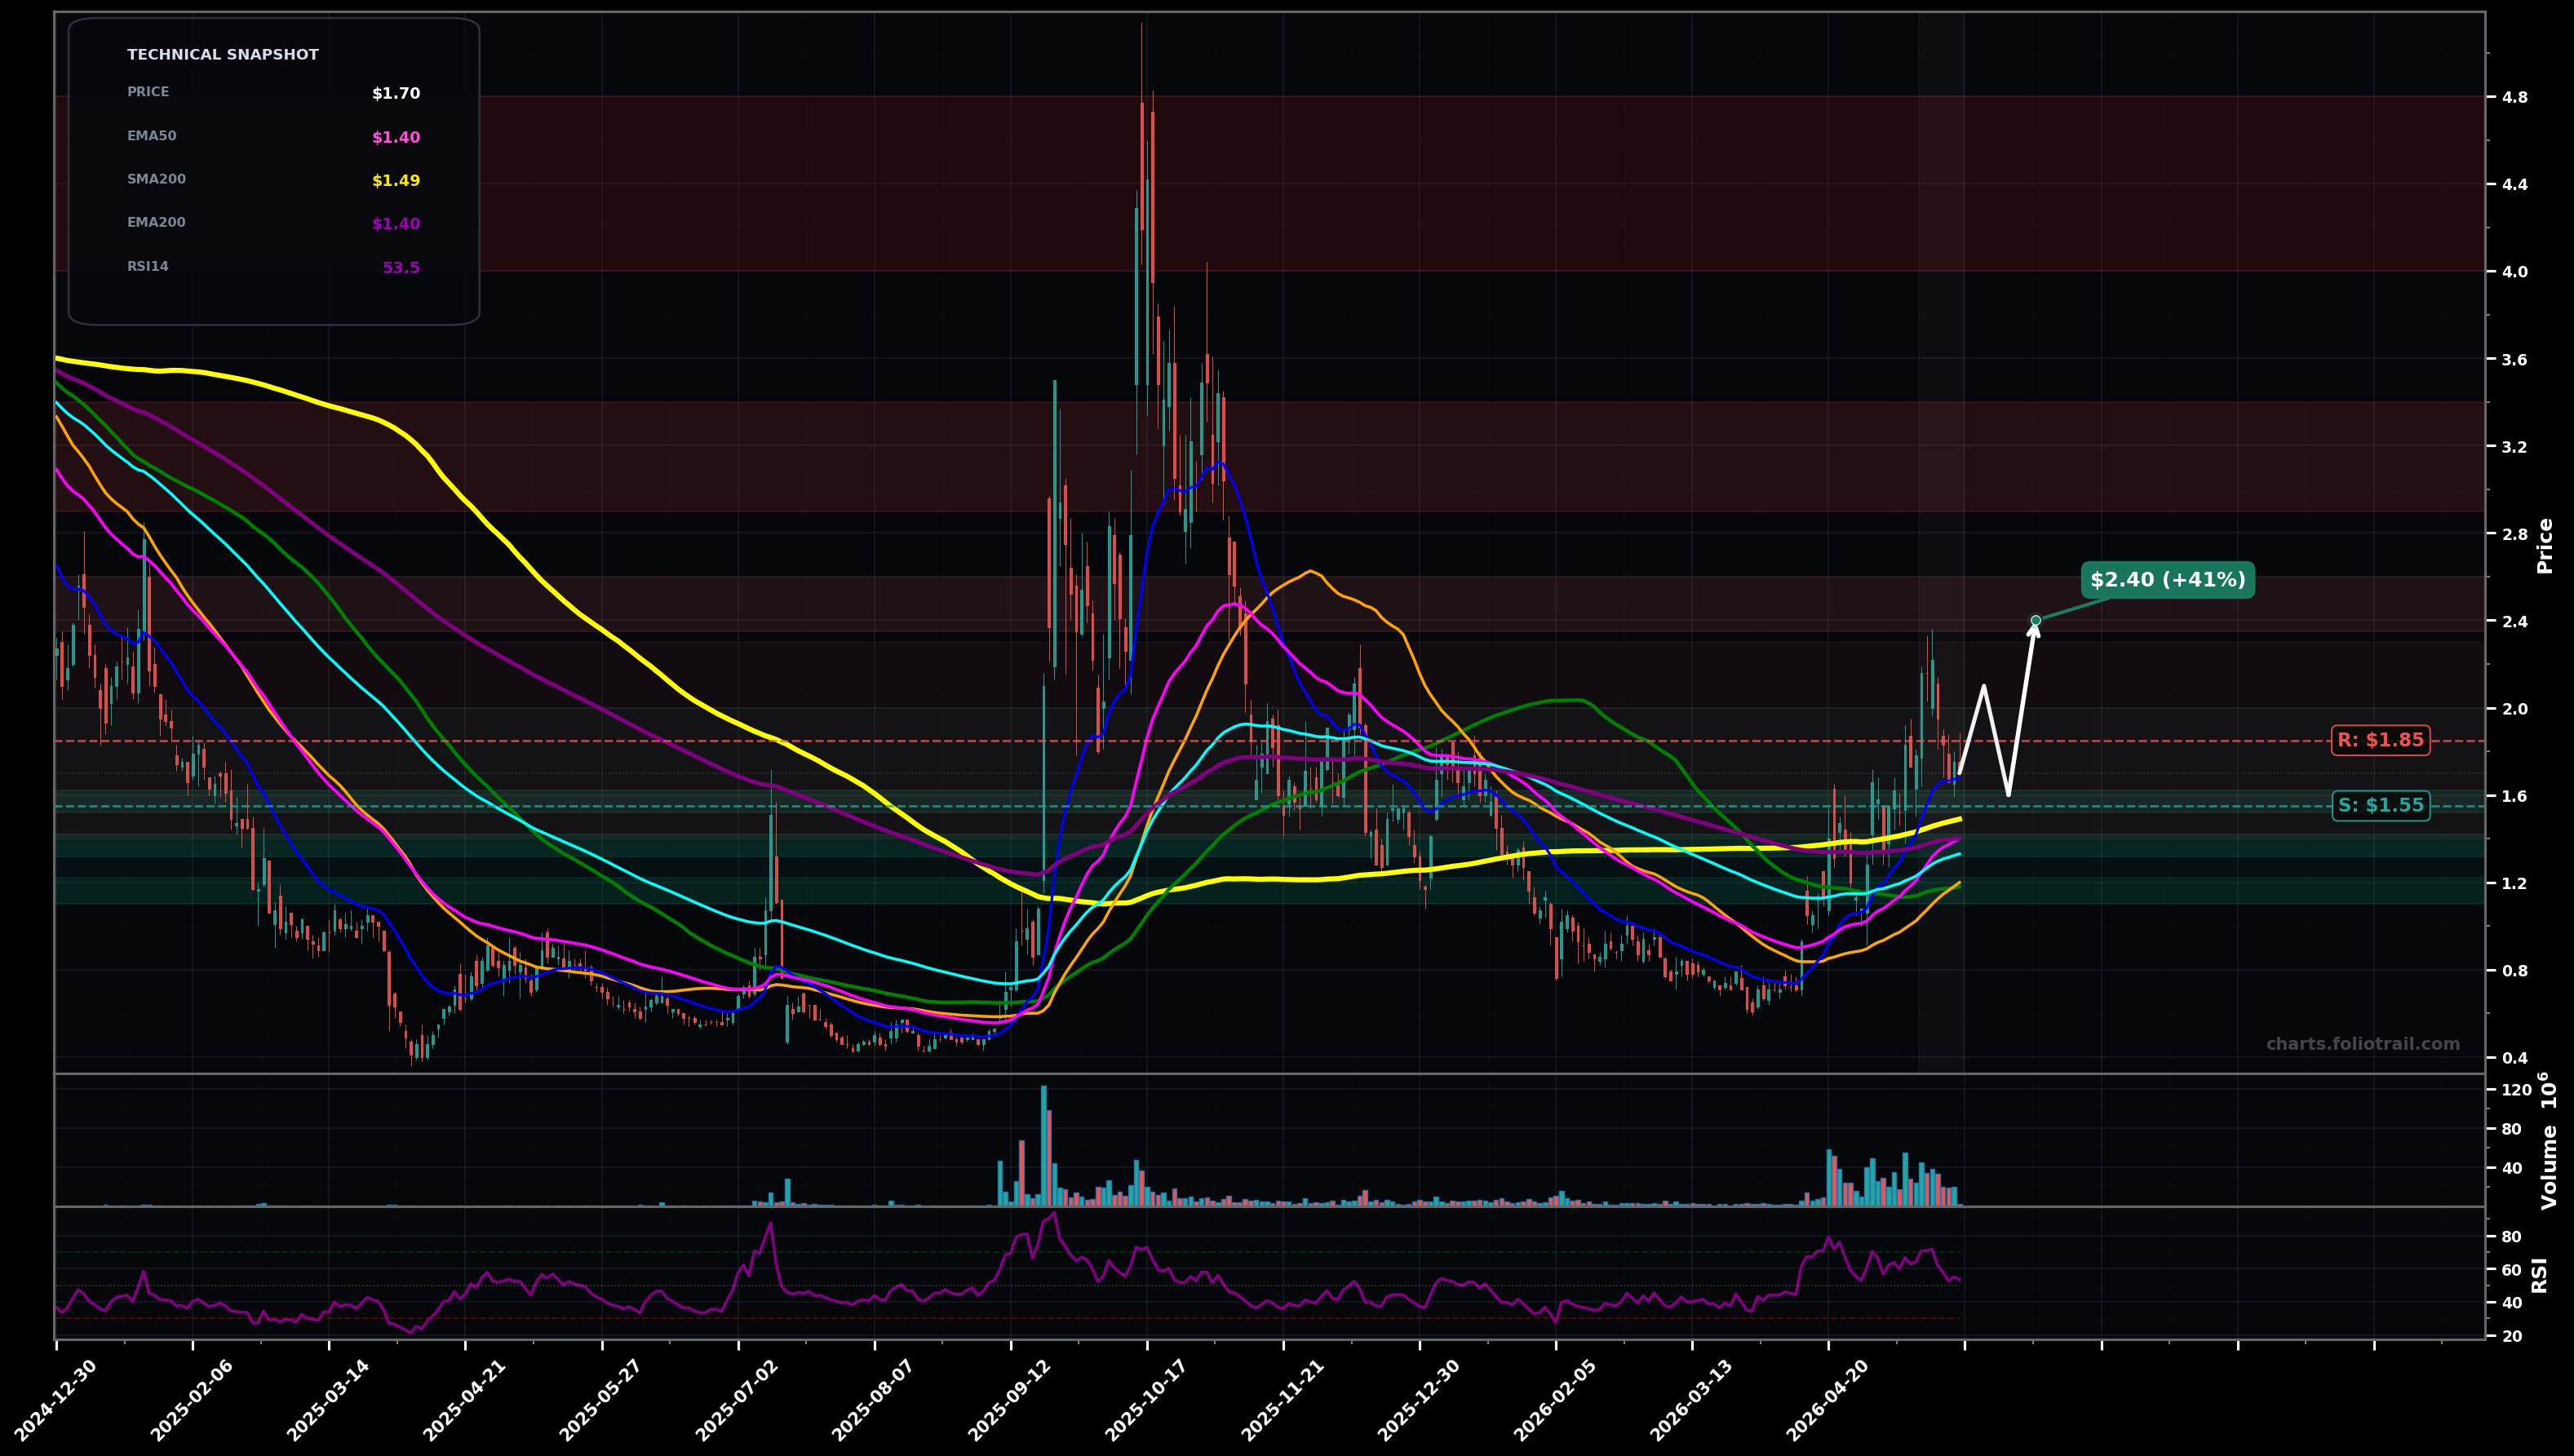
As of May 22, 2026, SLNH (Soluna Holdings Inc.) is in a breakout reversal state on the daily chart, with a confidence level of 63%. Key support is at $1.55 and key resistance at $1.85. Price at ~$1.70 is holding above EMA20 (~$1.67) after a sharp rally from the ~$0.90 base; recent candles show a pullback/consolidation under the $1.80-$2.00 area with RSI ~53.
Bullish continuation: price digests above the reclaimed EMA50/100 and breaks $1.85, then runs toward the prior supply zones; Elliott view: this looks like a Wave 3/impulse attempt off the ~$0.90 base with a Wave 4 pullback currently forming; Fib: using ~$0.90->~$2.10, a normal pullback band is ~38.2%-50% ($1.63-$1.50) before continuation.
Failed breakout / roll-over: rejection under $1.85-$2.00 leads to a breakdown back into the MA cluster; if $1.55 fails, price likely mean-reverts to the prior base top and the big volume shelf; Elliott view: the rally was a corrective A-B-C, now starting a larger C/impulse down; Fib risk: loss of the ~50% retrace (~$1.50) increases odds of a full retrace toward ~$1.20 and then ~$1.00.
2+ daily closes above $1.85 (with a higher low holding above ~$1.55).
Daily close below $1.40 (loss of EMA50/EMA200 cluster).
Start near Fib 38.2%-50% pullback + prior breakout area; add on EMA50/EMA200 loss retest (~$1.40); heavy add at prior base/supply flip near ~$1.10-$1.20 (must stabilize).
Trim into prior resistance/extension zones from the ~$0.90 base (measured move/Fib extensions) and historical supply near the post-spike distribution; fully exit if price revisits the $4+ blow-off area where prior sellers were dominant.
As of May 22, 2026, SLNH (Soluna Holdings Inc.) is in a breakout reversal state on the daily chart with 63% confidence. Price at ~$1.70 is holding above EMA20 (~$1.67) after a sharp rally from the ~$0.90 base; recent candles show a pullback/consolidation under the $1.80-$2.00 area with RSI ~53.
On the daily timeframe, SLNH has key support at $1.55 and key resistance at $1.85. The most likely scenario (bullish) targets $2.10 and $2.40, with a revert level at $1.60.
SLNH (Soluna Holdings Inc.) is currently classified as breakout reversal on the daily chart, with 63% confidence. Confirmation requires: 2+ daily closes above $1.85 (with a higher low holding above ~$1.55). This would be invalidated by: Daily close below $1.40 (loss of EMA50/EMA200 cluster).
The most likely scenario (bullish) targets $2.10 and $2.40, with a revert level at $1.60. The alternative scenario (bearish) targets $1.40 and $1.20.
Multi-layer AI agents analyse 200+ stocks across daily, weekly, and monthly timeframes — producing market state classifications, price scenarios with targets, and position entry/exit levels. Daily charts updated every trading day at 6 PM ET. Weekly charts refresh Fridays. Monthly charts refresh on the last trading day of each month. No paywall. No sign-up required.
Built by Foliotrail.
All content on this website — including charts, analysis, price targets, support/resistance levels, and position zones — is generated entirely by AI and provided for educational and informational purposes only.
This is not financial advice. NEXUSNOIR VENTURES SL (the operator of this website) is not a registered investment adviser or broker-dealer. You should not make investment decisions based solely on this information. Always do your own research and consult a qualified financial advisor.
By continuing, you acknowledge that you have read and agree to our full disclaimer & terms of use and privacy policy.