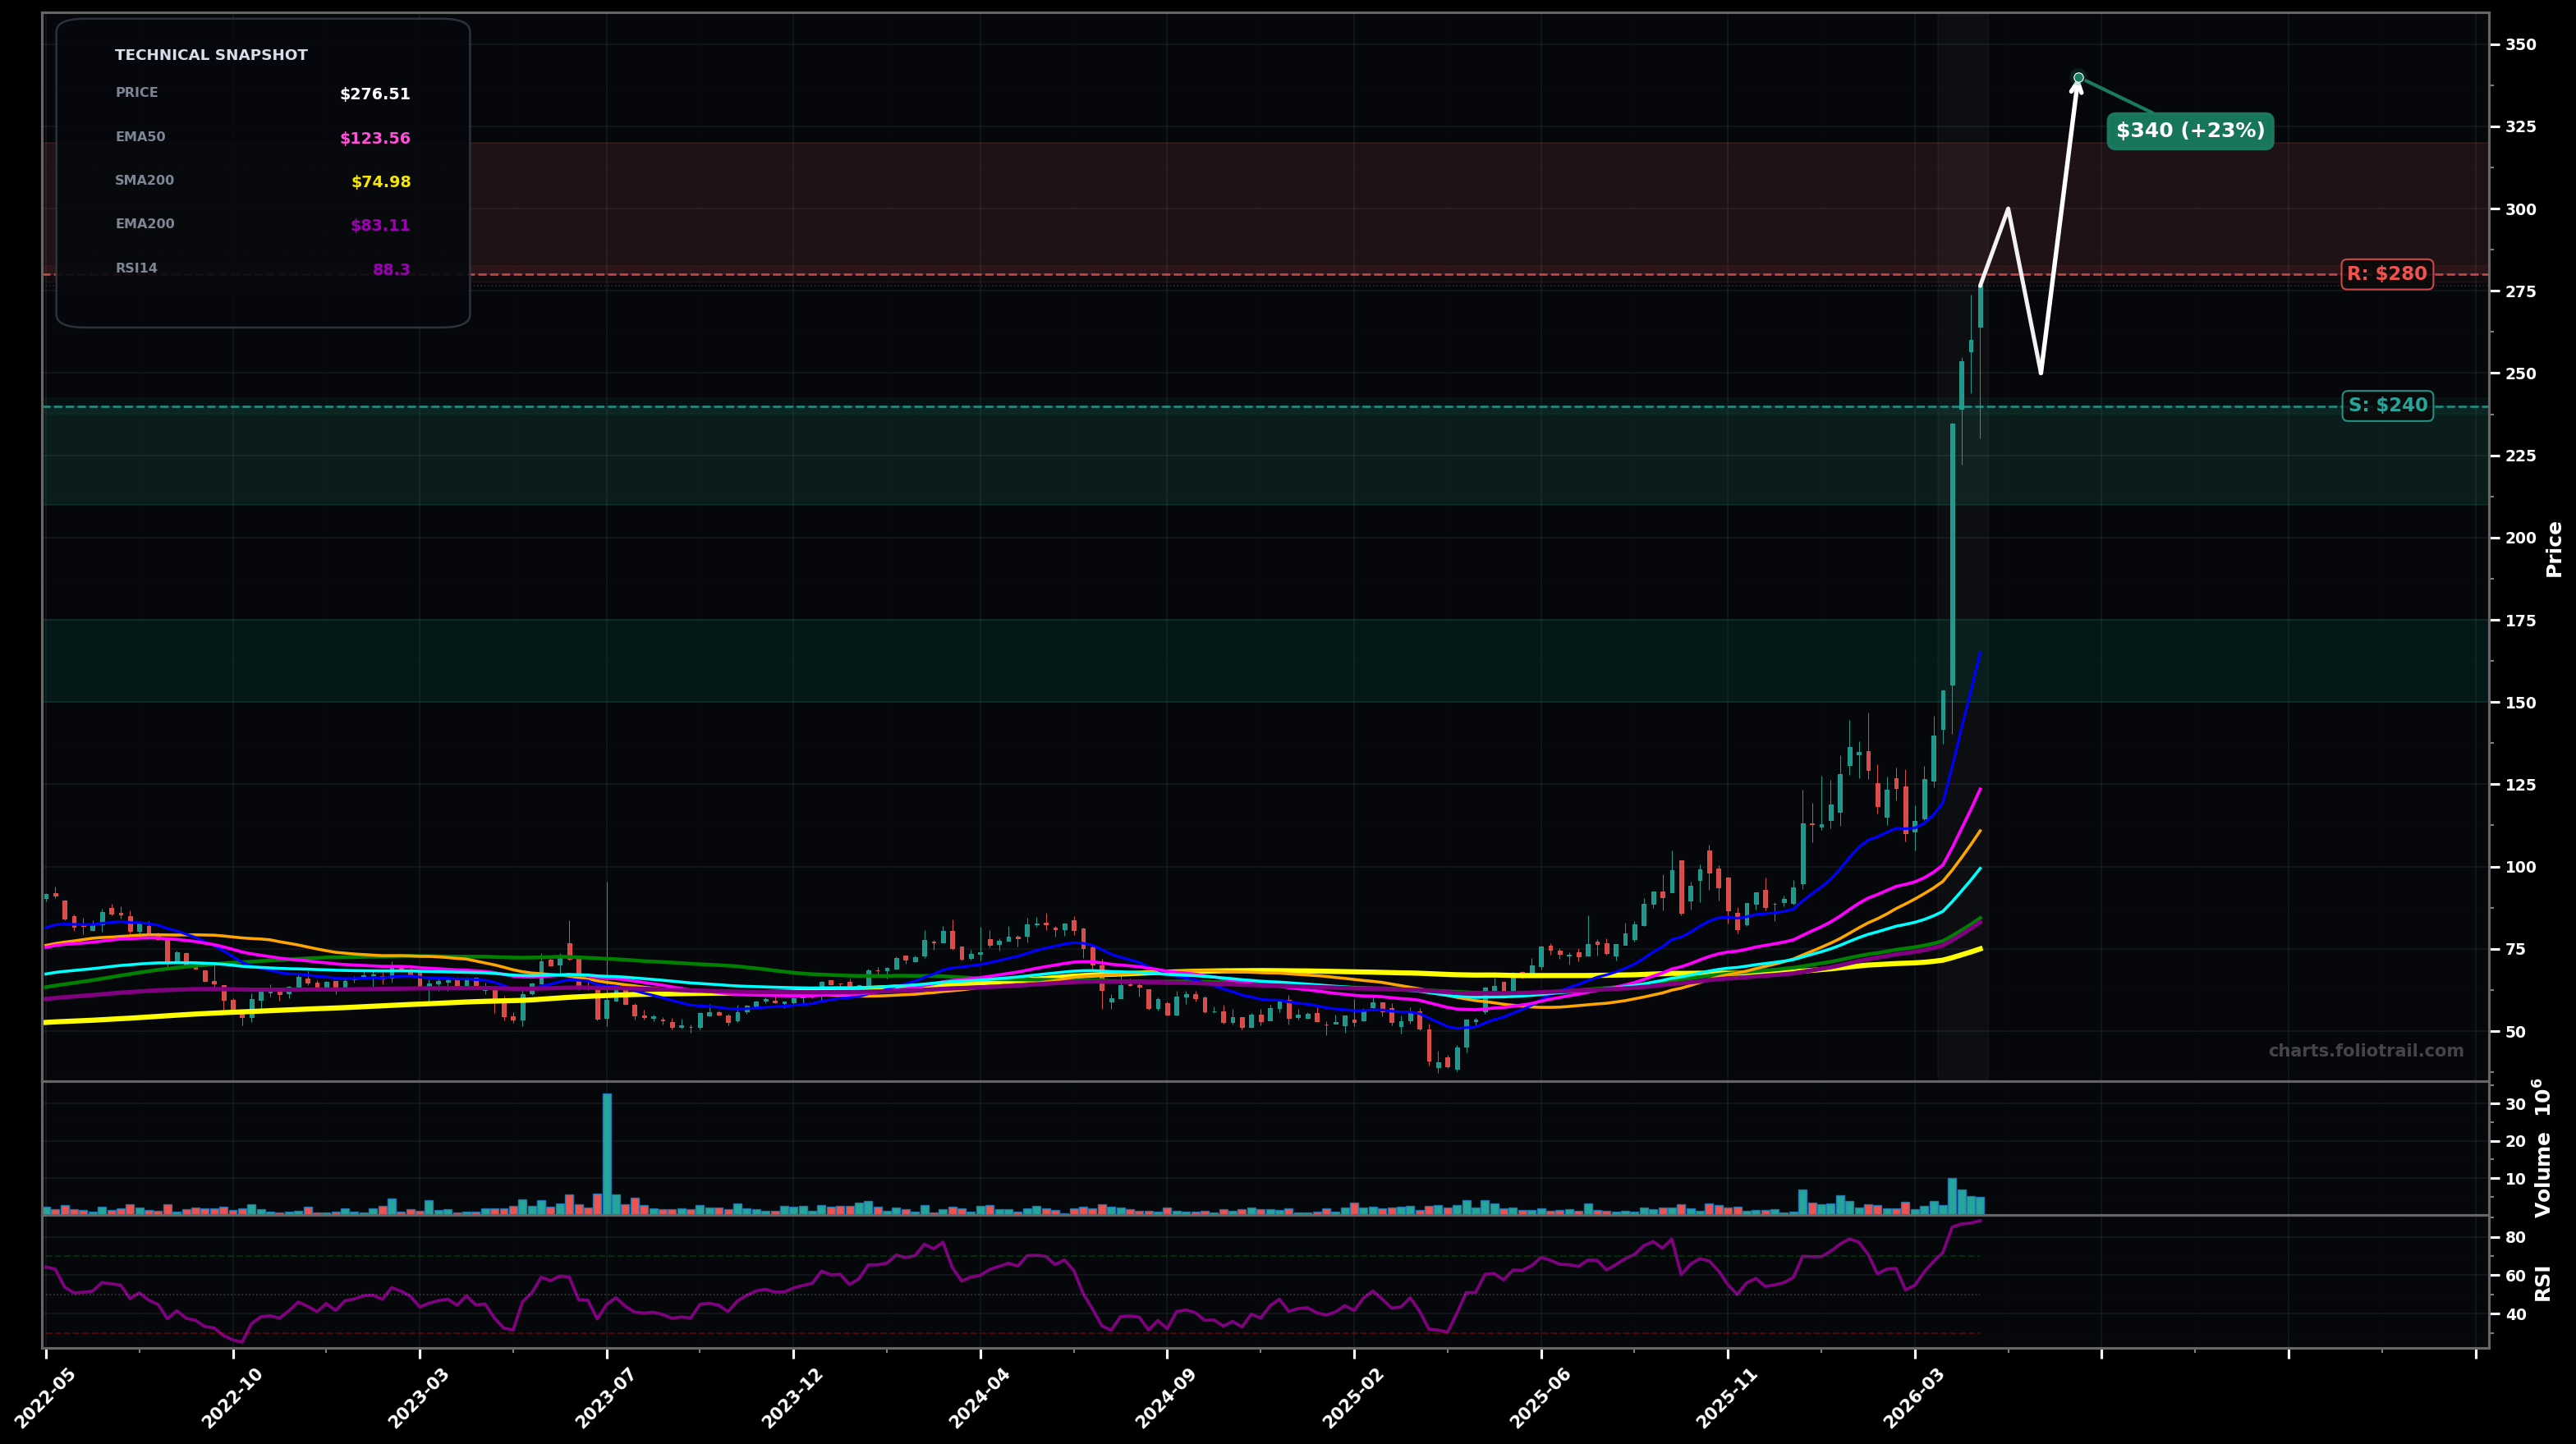
As of May 22, 2026, SIMO (Silicon Motion Technology Corp. American Depositary Receipt) is in a parabolic state on the weekly chart, with a confidence level of 86%. Key support is at $240 and key resistance at $280. Vertical breakout to new highs with big green weekly candles; price far above all MAs; RSI extremely overbought (~88).
Parabolic continuation (likely Wave 3/5 extension): after a brief consolidation/pullback, price pushes to a new high; watch for a volatility spike then grind higher.
Blow-off top then sharp mean-reversion (Wave 4 style): failed follow-through near highs triggers a fast drop toward prior breakout zone/EMA50 area before stabilizing.
Weekly close above $280 with continued higher weekly low above $240
Weekly close below $230 (loss of breakout + first major weekly breakdown)
Buy-the-dip zones aligned with prior breakout/round-number support ($240-$210) then deeper Fibonacci-style retrace toward EMA50 area (~$120-$130) not reached yet; use staged entries in case of a Wave 4 correction.
Parabolic extensions tend to mean-revert; trim into strength near psychological levels and measured-move extensions, then consider full exit if price becomes extremely detached from EMA50/EMA100 for multiple weeks.
As of May 22, 2026, SIMO (Silicon Motion Technology Corp. American Depositary Receipt) is in a parabolic state on the weekly chart with 86% confidence. Vertical breakout to new highs with big green weekly candles; price far above all MAs; RSI extremely overbought (~88).
On the weekly timeframe, SIMO has key support at $240 and key resistance at $280. The most likely scenario (bullish) targets $300 and $340, with a revert level at $250.
SIMO (Silicon Motion Technology Corp. American Depositary Receipt) is currently classified as parabolic on the weekly chart, with 86% confidence. Confirmation requires: Weekly close above $280 with continued higher weekly low above $240 This would be invalidated by: Weekly close below $230 (loss of breakout + first major weekly breakdown)
The most likely scenario (bullish) targets $300 and $340, with a revert level at $250. The alternative scenario (bearish) targets $210 and $165.
Multi-layer AI agents analyse 200+ stocks across daily, weekly, and monthly timeframes — producing market state classifications, price scenarios with targets, and position entry/exit levels. Daily charts updated every trading day at 6 PM ET. Weekly charts refresh Fridays. Monthly charts refresh on the last trading day of each month. No paywall. No sign-up required.
Built by Foliotrail.
All content on this website — including charts, analysis, price targets, support/resistance levels, and position zones — is generated entirely by AI and provided for educational and informational purposes only.
This is not financial advice. NEXUSNOIR VENTURES SL (the operator of this website) is not a registered investment adviser or broker-dealer. You should not make investment decisions based solely on this information. Always do your own research and consult a qualified financial advisor.
By continuing, you acknowledge that you have read and agree to our full disclaimer & terms of use and privacy policy.