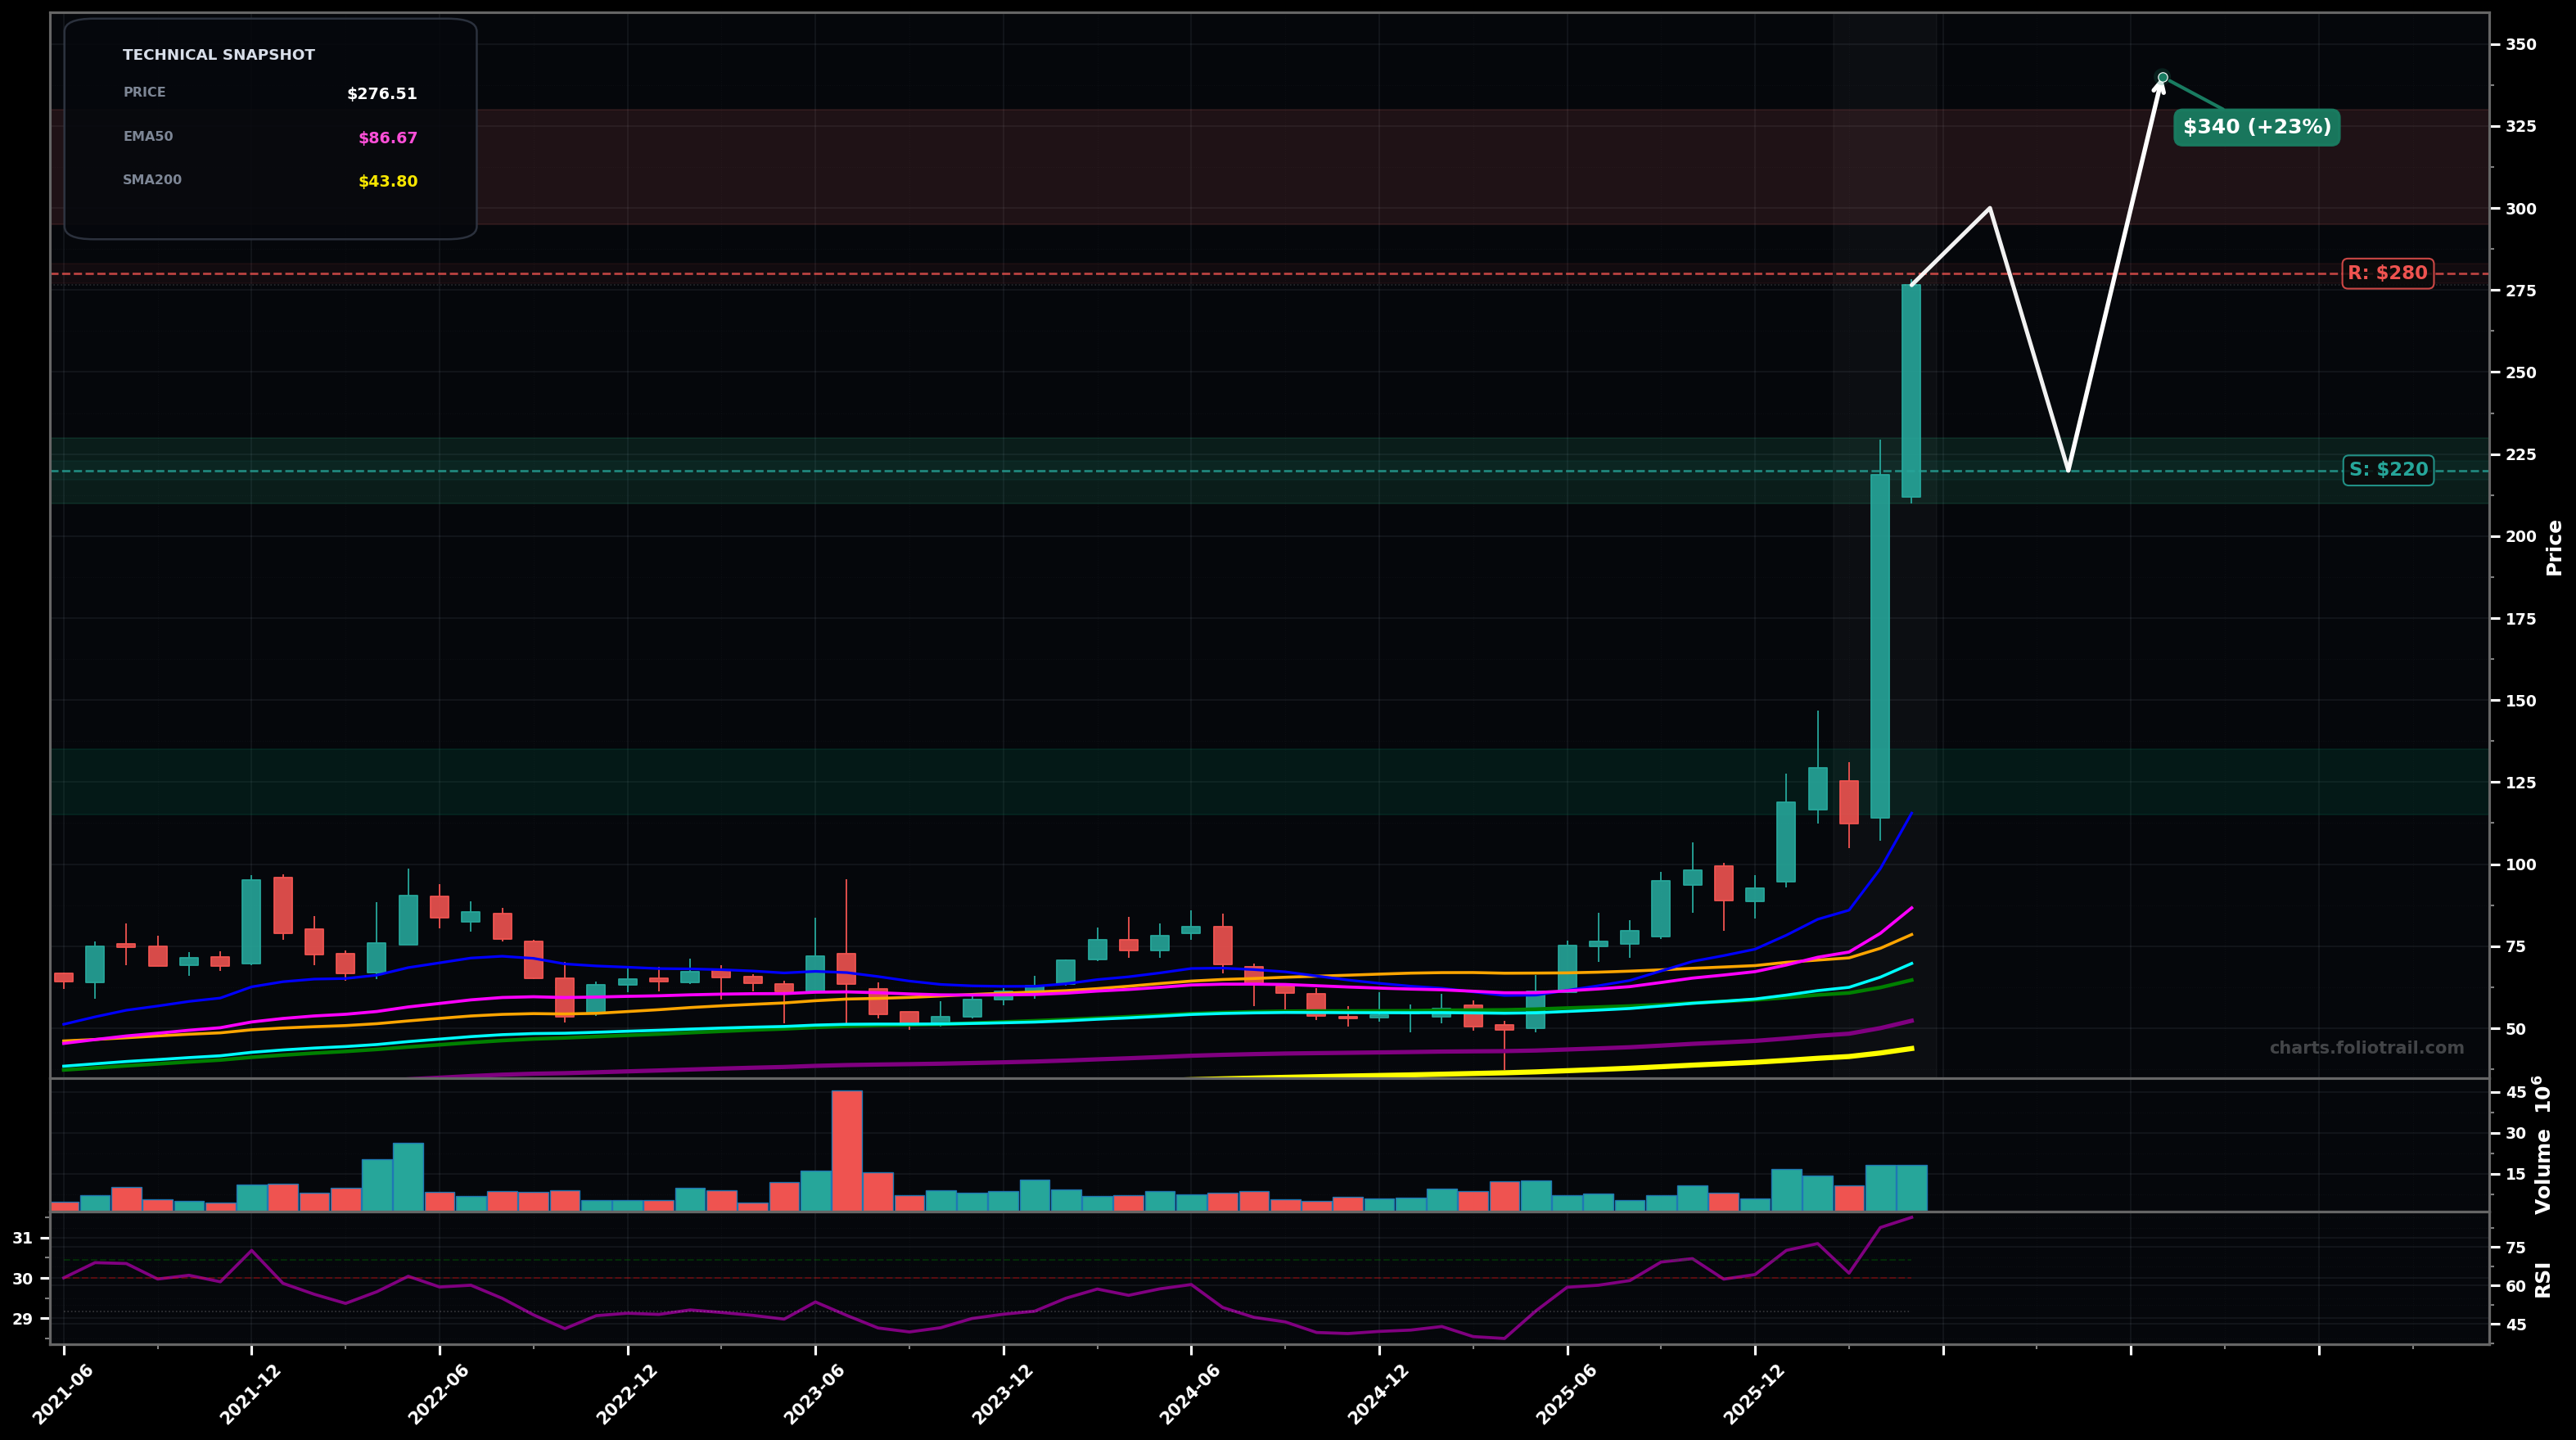
As of May 22, 2026, SIMO (Silicon Motion Technology Corp. American Depositary Receipt) is in a parabolic state on the monthly chart, with a confidence level of 73%. Key support is at $220 and key resistance at $280. Monthly vertical breakout to ~$276.51 with RSI-14 ~86.6; price extremely extended above all key EMAs/SMAs after a multi-month acceleration.
Parabolic continues but with volatility: brief pullback/inside month then push to a new high; typical Elliott wave extension behavior (late wave 3 / early wave 5 feel).
Blow-off top then larger mean-reversion: sharp retrace toward the breakout shelf and fast MAs; could be an ABC correction after an impulsive 5-wave advance.
2 monthly closes holding above ~$220
Monthly close back below ~$170
Use the breakout shelf (~$220) for a starter, then scale on deeper fib/mean-reversion pulls toward prior pivot zone (~$170) and the next major confluence near the rising EMA20 area (~$115).
RSI/price are in climax territory; trim into round-number extensions and likely fib projections (psych levels ~$300/$350+), and fully exit only if an extreme multi-year overshoot develops.
As of May 22, 2026, SIMO (Silicon Motion Technology Corp. American Depositary Receipt) is in a parabolic state on the monthly chart with 73% confidence. Monthly vertical breakout to ~$276.51 with RSI-14 ~86.6; price extremely extended above all key EMAs/SMAs after a multi-month acceleration.
On the monthly timeframe, SIMO has key support at $220 and key resistance at $280. The most likely scenario (bullish) targets $300 and $340, with a revert level at $220.
SIMO (Silicon Motion Technology Corp. American Depositary Receipt) is currently classified as parabolic on the monthly chart, with 73% confidence. Confirmation requires: 2 monthly closes holding above ~$220 This would be invalidated by: Monthly close back below ~$170
The most likely scenario (bullish) targets $300 and $340, with a revert level at $220. The alternative scenario (bearish) targets $170 and $120.
Multi-layer AI agents analyse 200+ stocks across daily, weekly, and monthly timeframes — producing market state classifications, price scenarios with targets, and position entry/exit levels. Daily charts updated every trading day at 6 PM ET. Weekly charts refresh Fridays. Monthly charts refresh on the last trading day of each month. No paywall. No sign-up required.
Built by Foliotrail.
All content on this website — including charts, analysis, price targets, support/resistance levels, and position zones — is generated entirely by AI and provided for educational and informational purposes only.
This is not financial advice. NEXUSNOIR VENTURES SL (the operator of this website) is not a registered investment adviser or broker-dealer. You should not make investment decisions based solely on this information. Always do your own research and consult a qualified financial advisor.
By continuing, you acknowledge that you have read and agree to our full disclaimer & terms of use and privacy policy.