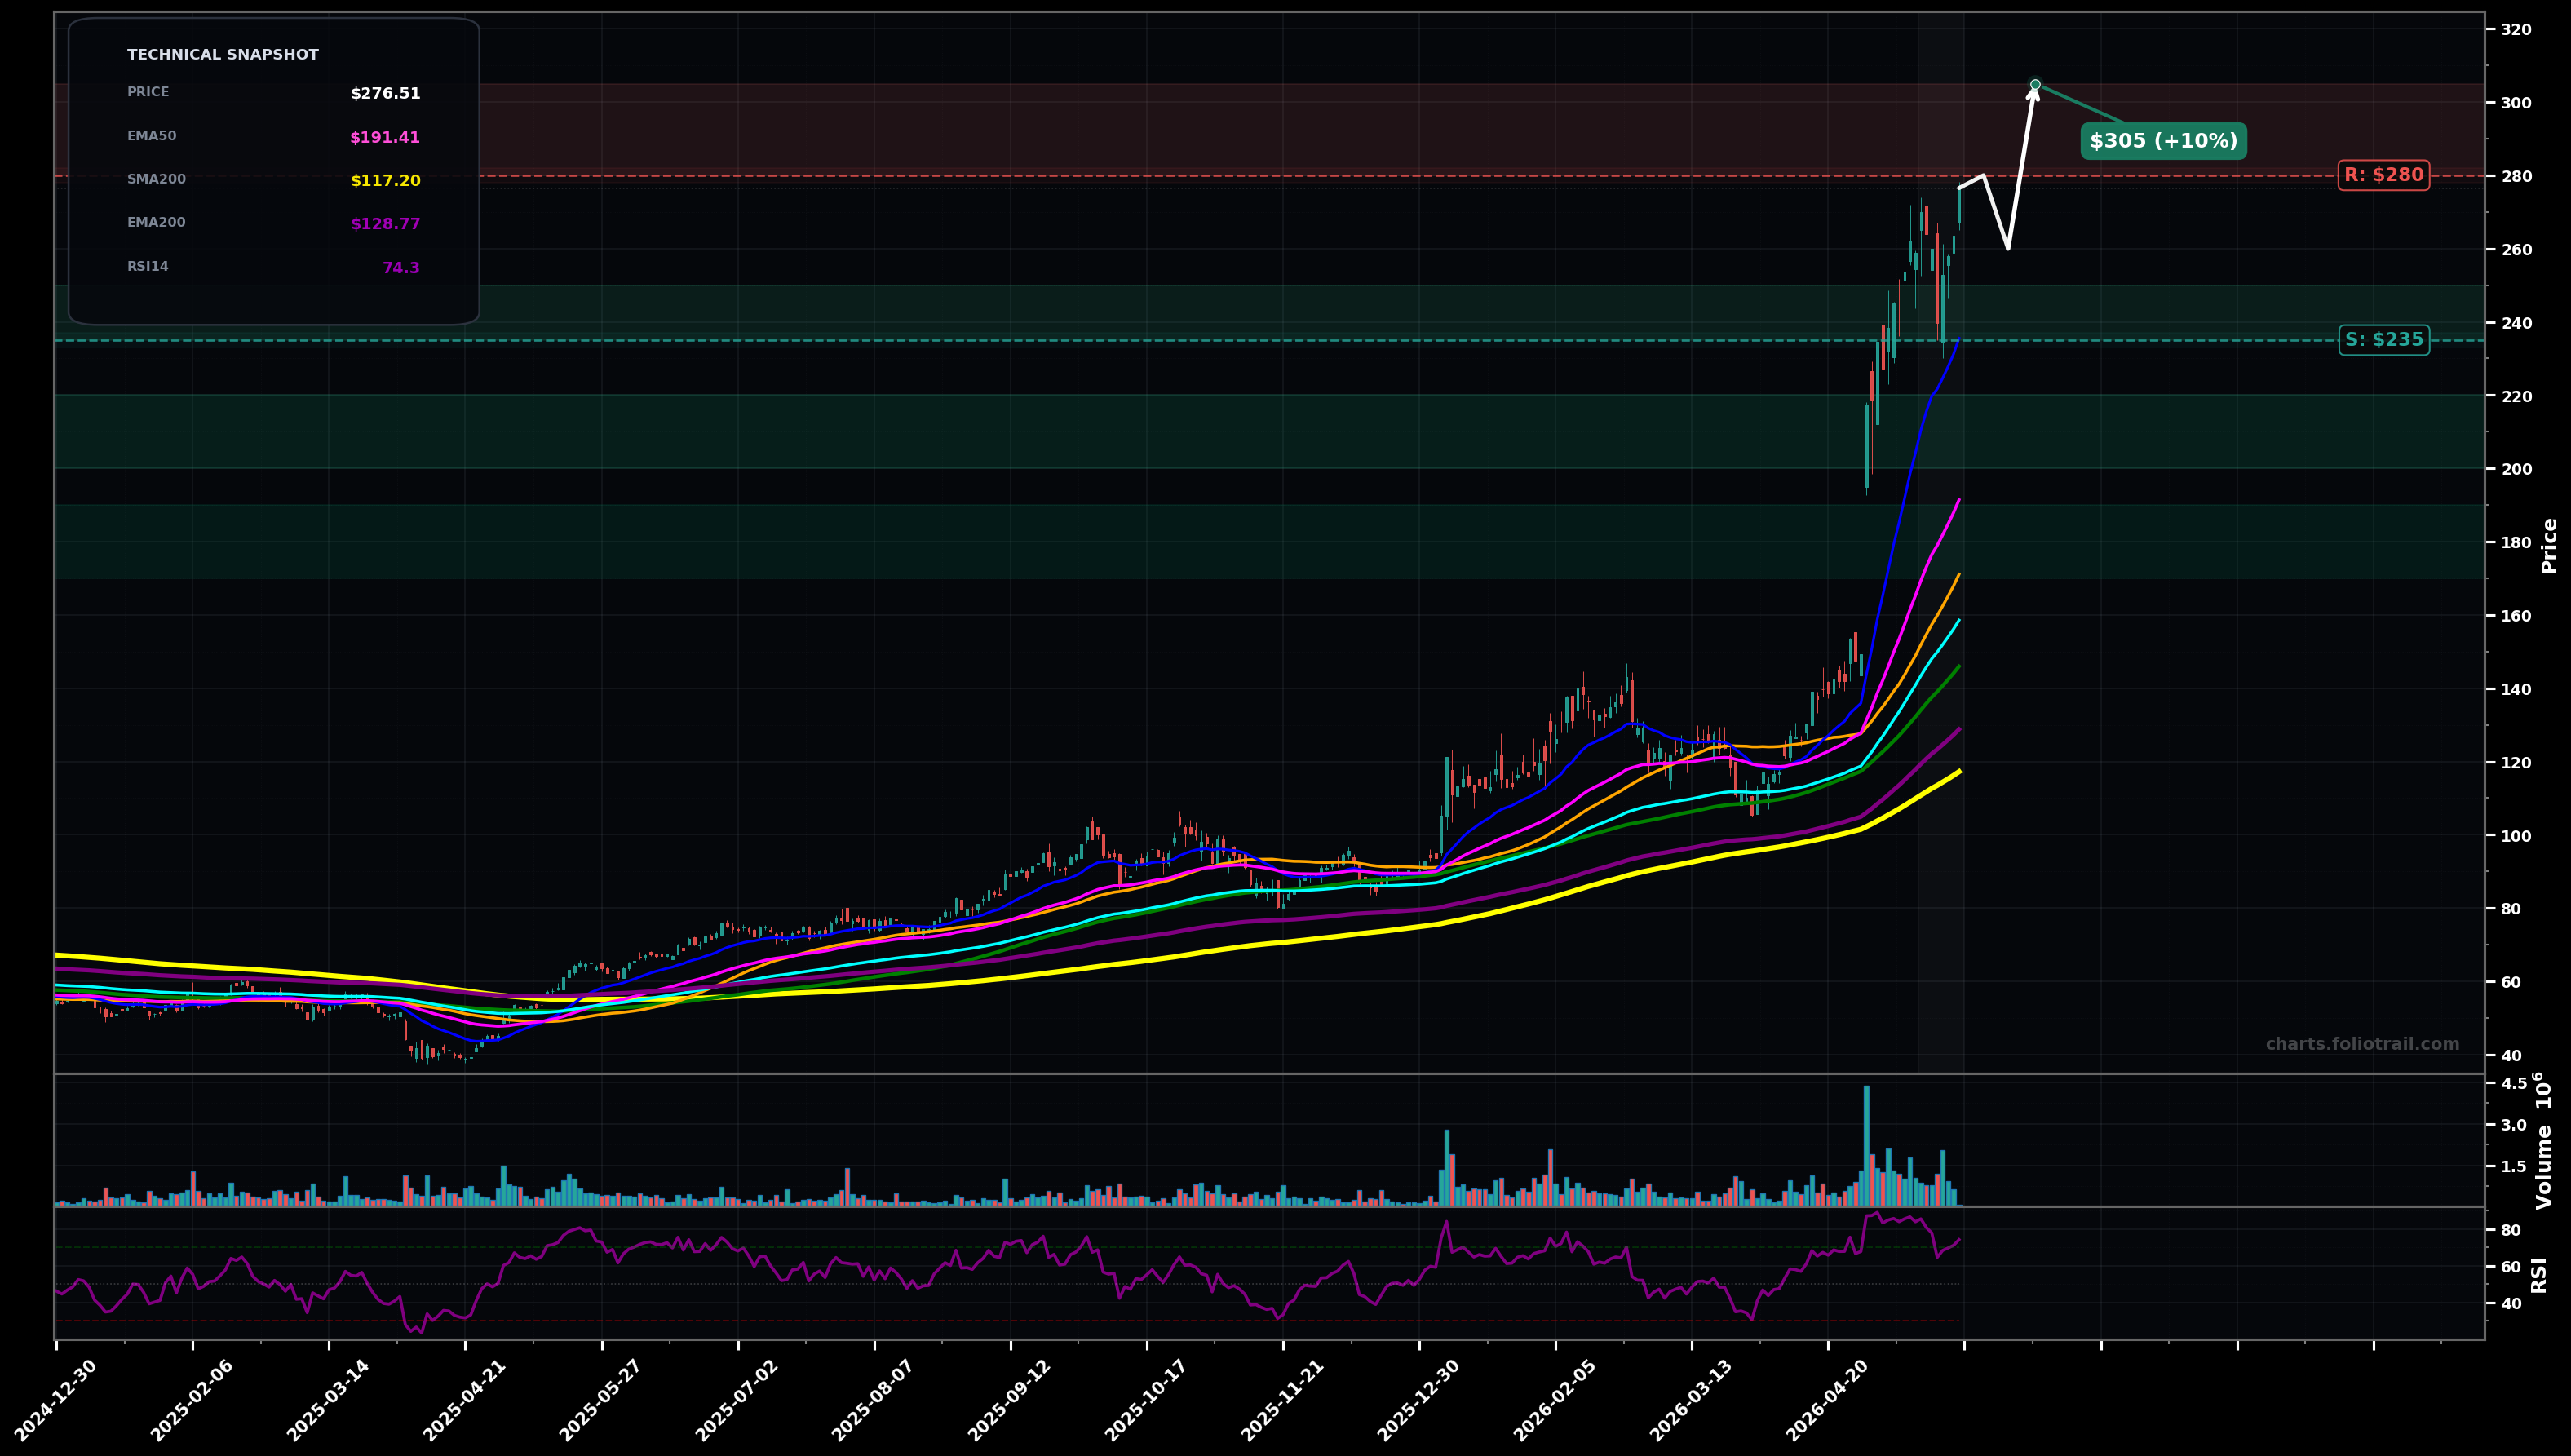
As of May 22, 2026, SIMO (Silicon Motion Technology Corp. American Depositary Receipt) is in a parabolic state on the daily chart, with a confidence level of 76%. Key support is at $235 and key resistance at $280. Strong HH/HL advance with a sharp impulse leg into new highs; price ($276.51) is far above rising EMA50 ($191.41) and EMA100 ($158.55) with RSI-14 ~74 (overbought/extended).
Bullish continuation after a brief consolidation: digestion above $260 then push to a measured extension; Elliott view: still in late Wave 3 or extending Wave 5 with shallow pullbacks.
Bearish mean-reversion: parabolic leg cools off with a deeper retrace toward the fast/medium trend MAs; Elliott view: Wave 4-style correction (sharp or sideways) before any next attempt higher.
Hold above $260 on daily closes while EMA50 continues rising
Daily close below $235 (loss of the most recent breakout/pivot area) would shift to VOLATILITY_EXPANSION / deeper pullback risk
Buy-the-dip zones mapped to likely Wave-4 / Fibonacci retrace pockets and MA magnets: ~$235 prior breakout/swing area, ~$200 psychological + mid-trend support, ~$170–$190 near rising EMA50 zone for deeper reset.
Trim into extension/RSI strength near fib-style upside extensions above prior highs; higher bands assume continued parabolic behavior and increasing odds of a multi-week/month mean reversion.
As of May 22, 2026, SIMO (Silicon Motion Technology Corp. American Depositary Receipt) is in a parabolic state on the daily chart with 76% confidence. Strong HH/HL advance with a sharp impulse leg into new highs; price ($276.51) is far above rising EMA50 ($191.41) and EMA100 ($158.55) with RSI-14 ~74 (overbought/extended).
On the daily timeframe, SIMO has key support at $235 and key resistance at $280. The most likely scenario (bullish) targets $280 and $305, with a revert level at $260.
SIMO (Silicon Motion Technology Corp. American Depositary Receipt) is currently classified as parabolic on the daily chart, with 76% confidence. Confirmation requires: Hold above $260 on daily closes while EMA50 continues rising This would be invalidated by: Daily close below $235 (loss of the most recent breakout/pivot area) would shift to VOLATILITY_EXPANSION / deeper pullback risk
The most likely scenario (bullish) targets $280 and $305, with a revert level at $260. The alternative scenario (bearish) targets $235 and $200.
Multi-layer AI agents analyse 200+ stocks across daily, weekly, and monthly timeframes — producing market state classifications, price scenarios with targets, and position entry/exit levels. Daily charts updated every trading day at 6 PM ET. Weekly charts refresh Fridays. Monthly charts refresh on the last trading day of each month. No paywall. No sign-up required.
Built by Foliotrail.
All content on this website — including charts, analysis, price targets, support/resistance levels, and position zones — is generated entirely by AI and provided for educational and informational purposes only.
This is not financial advice. NEXUSNOIR VENTURES SL (the operator of this website) is not a registered investment adviser or broker-dealer. You should not make investment decisions based solely on this information. Always do your own research and consult a qualified financial advisor.
By continuing, you acknowledge that you have read and agree to our full disclaimer & terms of use and privacy policy.