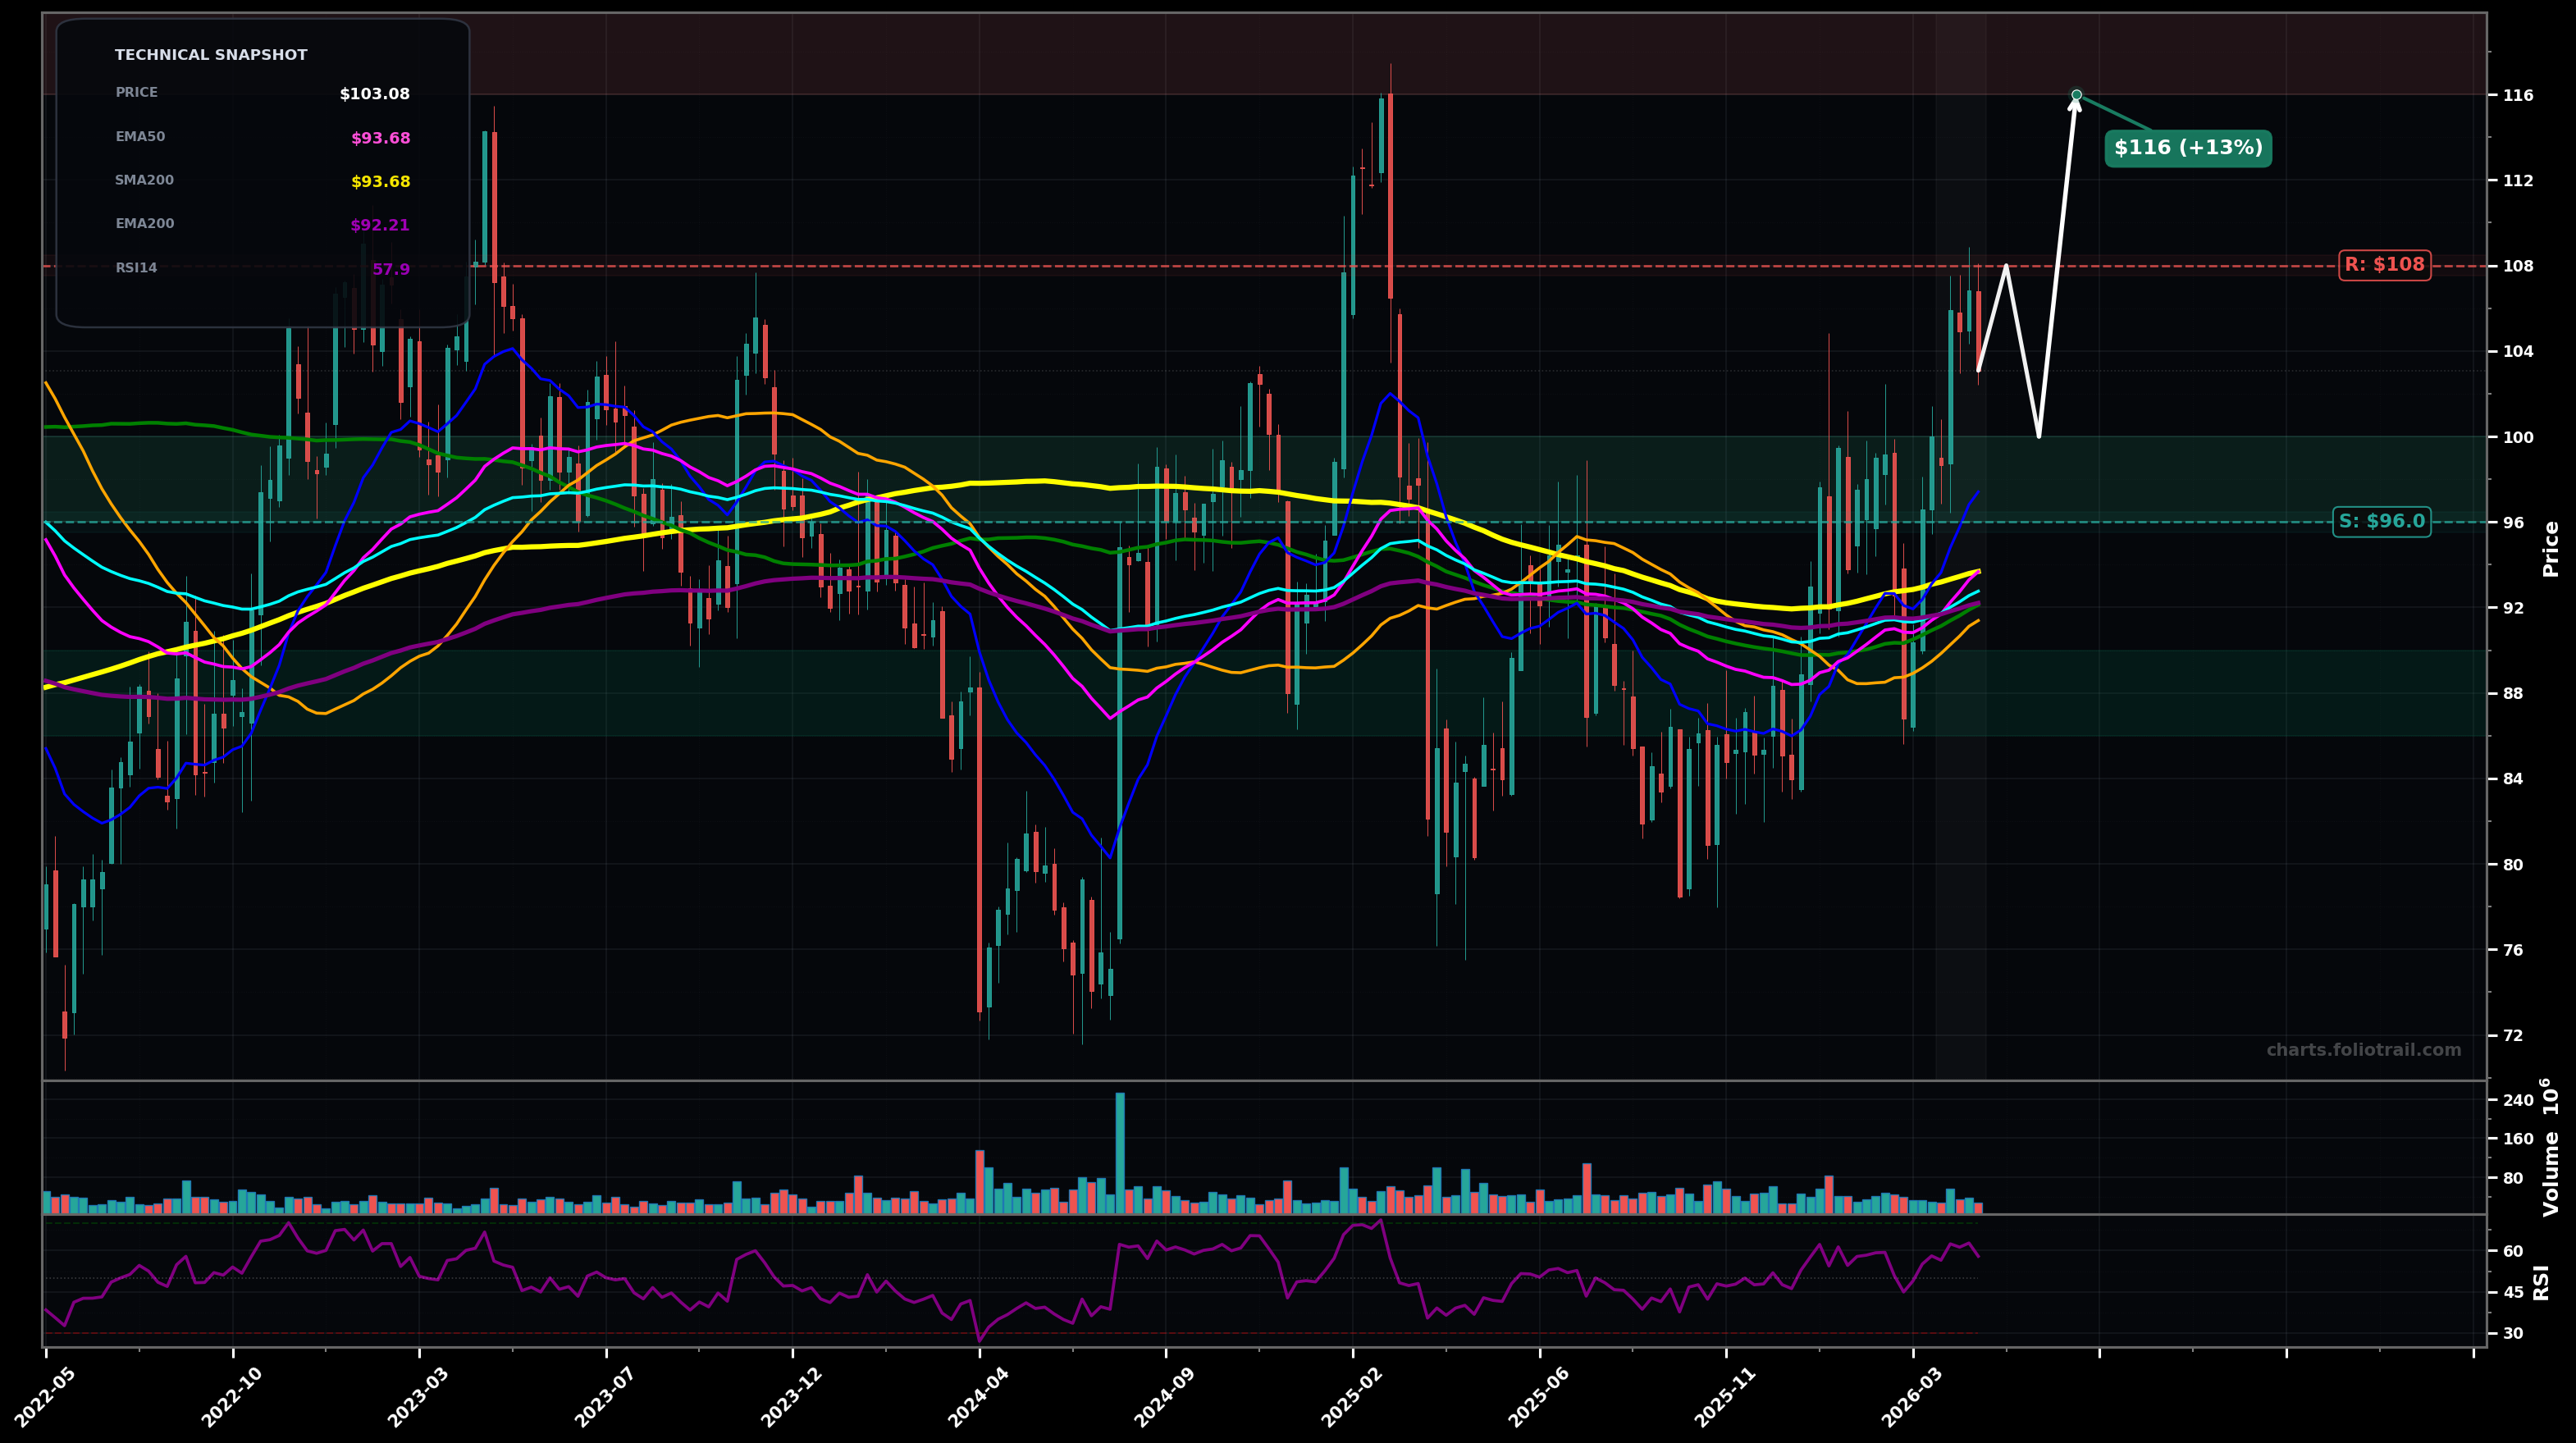
As of May 22, 2026, SBUX (Starbucks Corporation) is in a uptrend state on the weekly chart, with a confidence level of 67%. Key support is at $96.0 and key resistance at $108. Weekly trend turned up with a strong rally from the $86–$90 base; price now at ~$103 and consolidating below the prior supply zone (~$105–$108) while holding above all key MAs.
Bullish continuation: shallow pullback/sideways above $96–$100, then a break of $108 to retest the 2024/25 supply and extend higher (likely Wave 3/5 continuation from the $86 base).
Bearish rotation: rejection at $105–$108 followed by a deeper mean-reversion into the MA cluster; this would look like a Wave 2 / Wave B pullback within the larger recovery structure.
Weekly close above $108 with follow-through (next week not losing $105).
Weekly close below $96 (back under reclaimed MA cluster and prior breakout zone).
Start on pullbacks to prior breakout/round-number support ($96–$100); add into EMA/SMA cluster ($92–$96); heavy add only on a retest of the proven weekly base and swing low demand ($86–$90).
Trim into prior major weekly supply and extension zones above the last impulse high (~$116+), increase trimming as price becomes extended vs the MA cluster, and fully exit only on a multi-year overextension blow-off toward $140–$155.
As of May 22, 2026, SBUX (Starbucks Corporation) is in a uptrend state on the weekly chart with 67% confidence. Weekly trend turned up with a strong rally from the $86–$90 base; price now at ~$103 and consolidating below the prior supply zone (~$105–$108) while holding above all key MAs.
On the weekly timeframe, SBUX has key support at $96.0 and key resistance at $108. The most likely scenario (bullish) targets $108 and $116, with a revert level at $100.
SBUX (Starbucks Corporation) is currently classified as uptrend on the weekly chart, with 67% confidence. Confirmation requires: Weekly close above $108 with follow-through (next week not losing $105). This would be invalidated by: Weekly close below $96 (back under reclaimed MA cluster and prior breakout zone).
The most likely scenario (bullish) targets $108 and $116, with a revert level at $100. The alternative scenario (bearish) targets $96.0 and $92.0.
Multi-layer AI agents analyse 200+ stocks across daily, weekly, and monthly timeframes — producing market state classifications, price scenarios with targets, and position entry/exit levels. Daily charts updated every trading day at 6 PM ET. Weekly charts refresh Fridays. Monthly charts refresh on the last trading day of each month. No paywall. No sign-up required.
Built by Foliotrail.
All content on this website — including charts, analysis, price targets, support/resistance levels, and position zones — is generated entirely by AI and provided for educational and informational purposes only.
This is not financial advice. NEXUSNOIR VENTURES SL (the operator of this website) is not a registered investment adviser or broker-dealer. You should not make investment decisions based solely on this information. Always do your own research and consult a qualified financial advisor.
By continuing, you acknowledge that you have read and agree to our full disclaimer & terms of use and privacy policy.