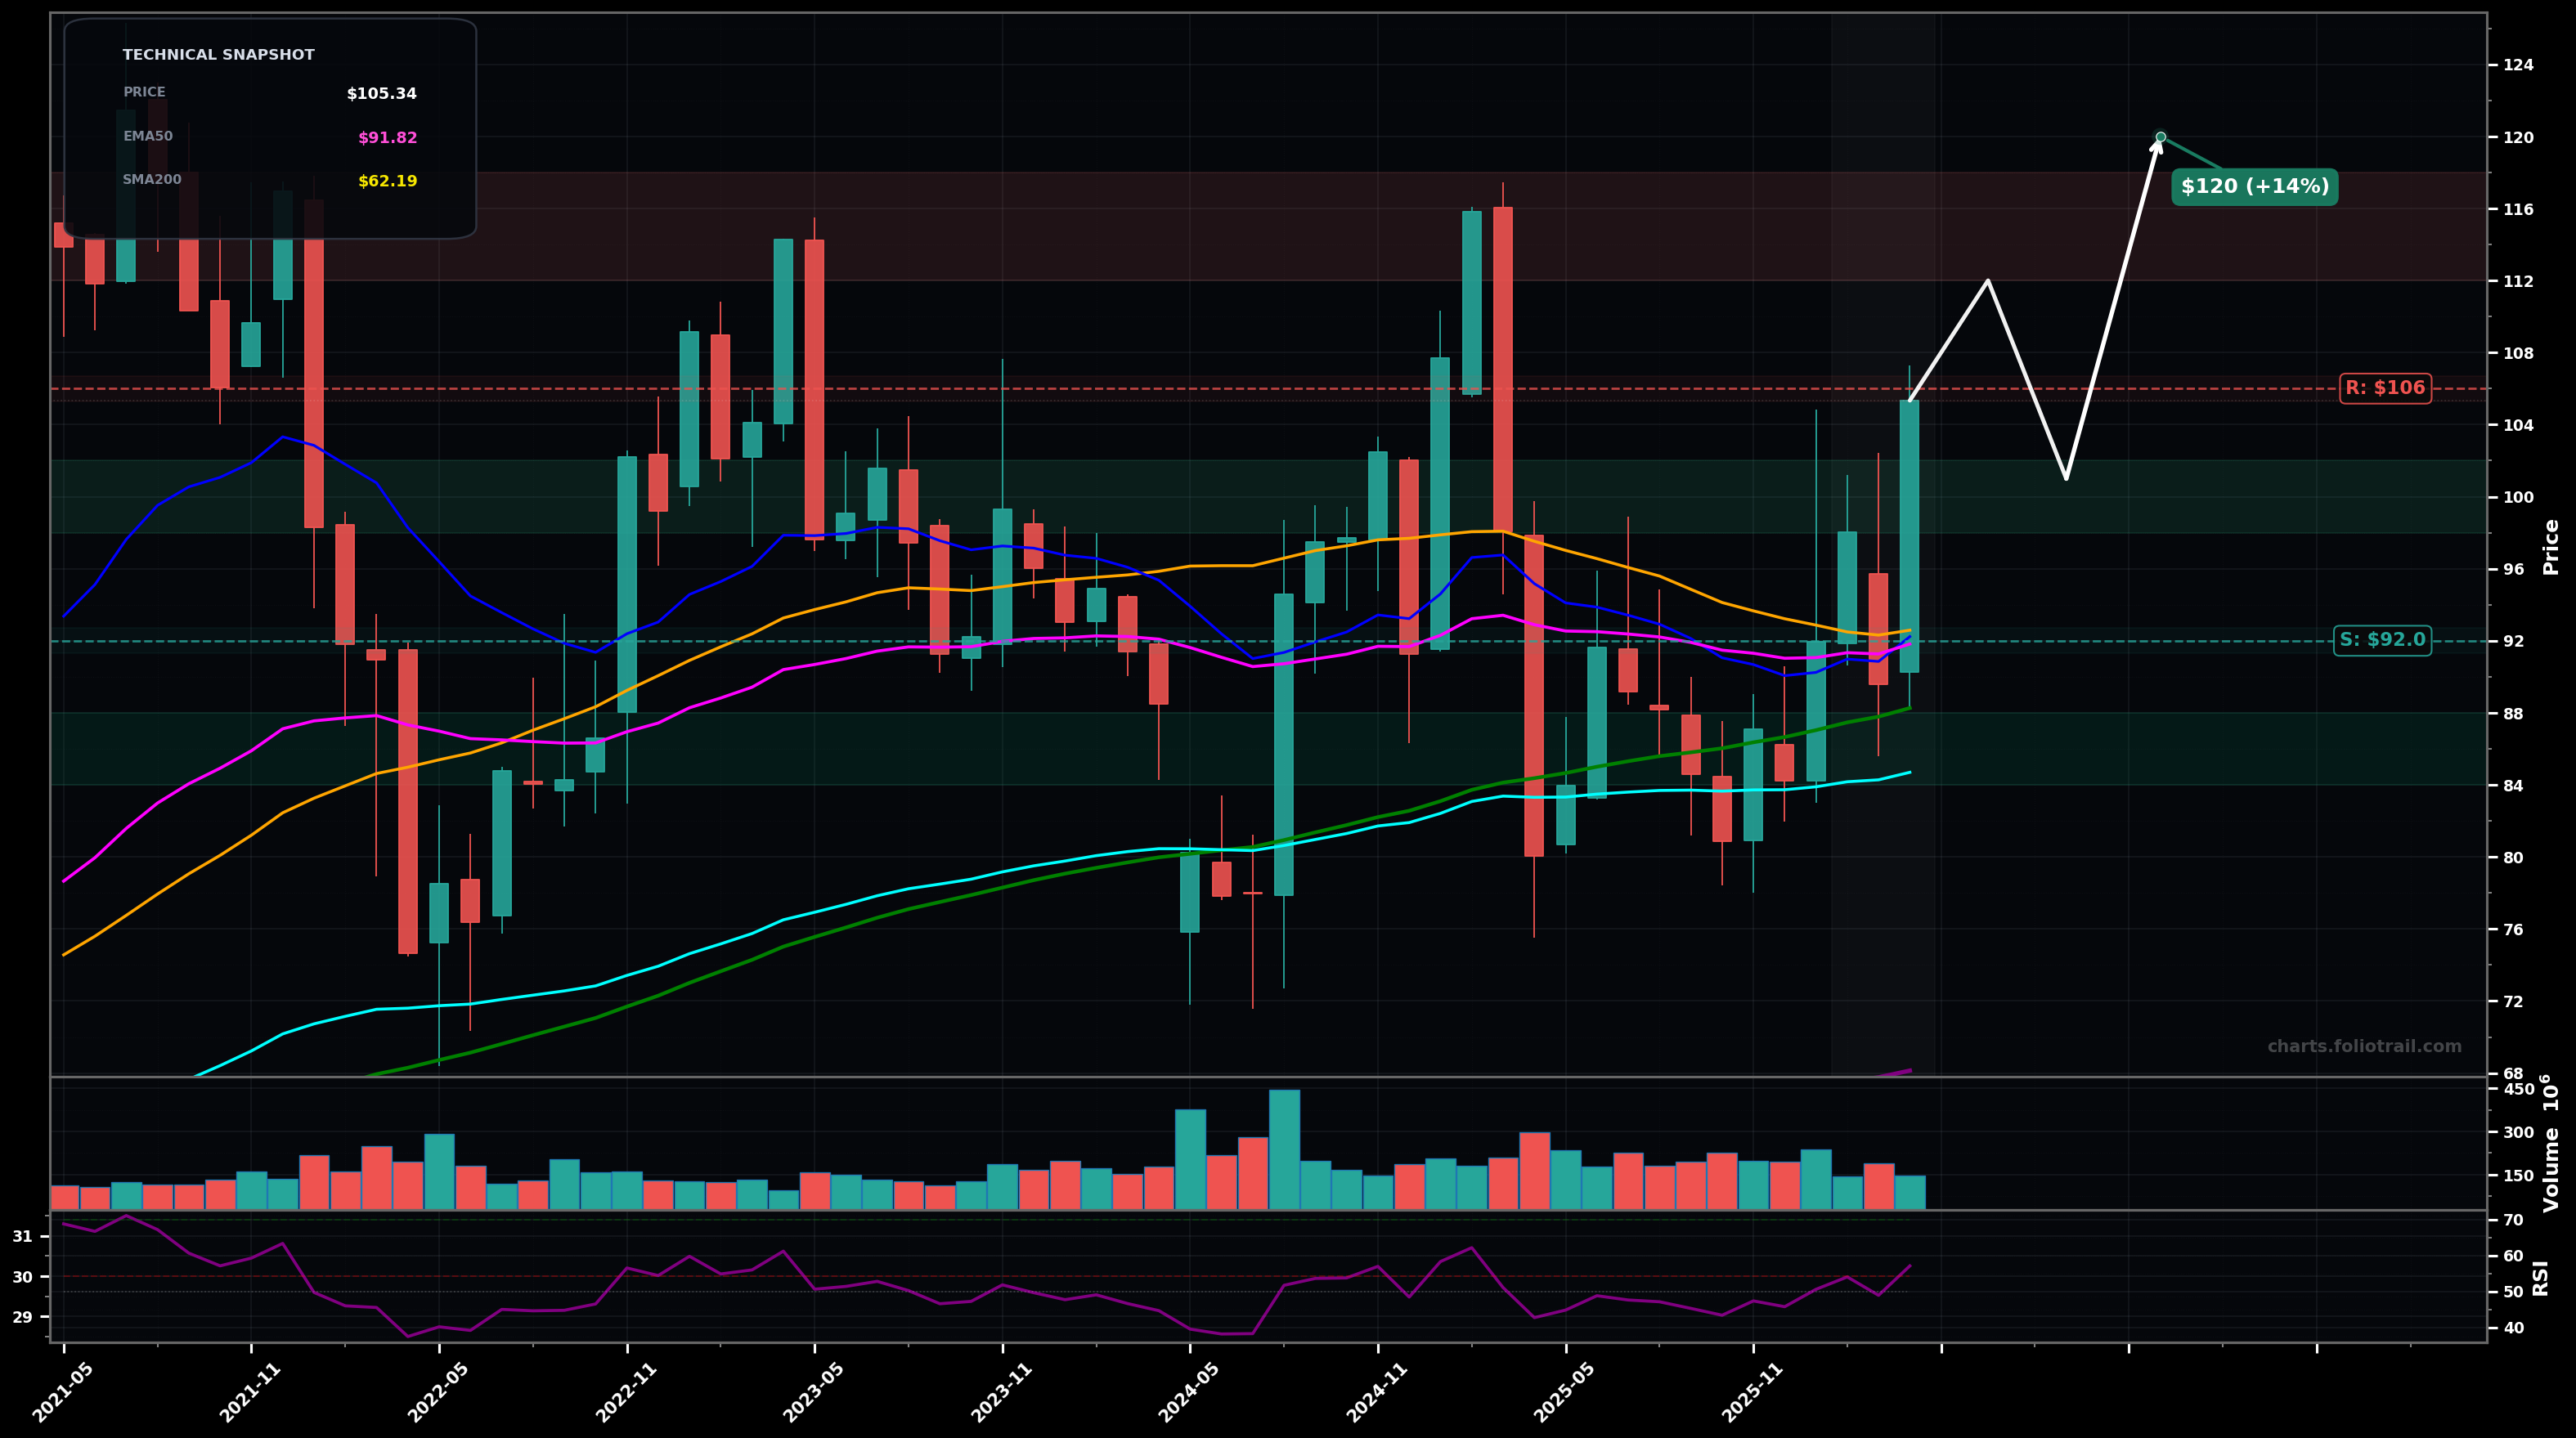
As of April 30, 2026, SBUX (Starbucks Corporation) is in a breakout reversal state on the monthly chart, with a confidence level of 63%. Key support is at $92.0 and key resistance at $106. Monthly candle has pushed back above the $100 area after a base around the low-$80s/upper-$80s, reclaiming key medium-term MAs (EMA50/EMA100) with RSI ~57.
Bullish continuation: pullback/retest toward the reclaimed MA cluster ($100–$102) then attempt to clear $106 and run into the prior supply zone; this aligns with an Elliott Wave view of an impulsive leg up (potential Wave 3/5 of a larger recovery) after a basing Wave 2/4-type correction. Fibonacci from the $78 swing low to ~$106 suggests the move can extend toward the 1.272–1.618 area.
Bearish fade: failure to hold above $100 leads to a breakdown back into the base; likely mean-reversion toward EMA100/SMA100 area as the rally is treated as a corrective Wave B/2 rather than a new impulse. Watch for rejection wicks near $106 and a heavier red monthly close.
2+ monthly closes above $106 (and holding above $100) would confirm breakout continuation
A monthly close back below $92 would invalidate the breakout-reversal and shift bias to range/downtrend
Scale in on a breakout retest ($100 area), add at the EMA50/SMA50 breakdown line (~$92–$96), and deploy heavier near the EMA100/SMA100 demand shelf (~$84–$88) that has repeatedly stabilized price.
Trim into prior supply/extension zones: first near pre-breakdown resistance ($112–$118), more if price stretches into fib-extension/ATH-adjacent territory ($120–$130), and consider full exit if a multi-year overextension prints ($132–$145) versus the MA stack.
As of April 30, 2026, SBUX (Starbucks Corporation) is in a breakout reversal state on the monthly chart with 63% confidence. Monthly candle has pushed back above the $100 area after a base around the low-$80s/upper-$80s, reclaiming key medium-term MAs (EMA50/EMA100) with RSI ~57.
On the monthly timeframe, SBUX has key support at $92.0 and key resistance at $106. The most likely scenario (bullish) targets $112 and $120, with a revert level at $101.
SBUX (Starbucks Corporation) is currently classified as breakout reversal on the monthly chart, with 63% confidence. Confirmation requires: 2+ monthly closes above $106 (and holding above $100) would confirm breakout continuation This would be invalidated by: A monthly close back below $92 would invalidate the breakout-reversal and shift bias to range/downtrend
The most likely scenario (bullish) targets $112 and $120, with a revert level at $101. The alternative scenario (bearish) targets $95.0 and $88.0.
Multi-layer AI agents analyse 200+ stocks across daily, weekly, and monthly timeframes — producing market state classifications, price scenarios with targets, and position entry/exit levels. Daily charts updated every trading day at 6 PM ET. Weekly charts refresh Fridays. Monthly charts refresh on the last trading day of each month. No paywall. No sign-up required.
Built by Foliotrail.
All content on this website — including charts, analysis, price targets, support/resistance levels, and position zones — is generated entirely by AI and provided for educational and informational purposes only.
This is not financial advice. NEXUSNOIR VENTURES SL (the operator of this website) is not a registered investment adviser or broker-dealer. You should not make investment decisions based solely on this information. Always do your own research and consult a qualified financial advisor.
By continuing, you acknowledge that you have read and agree to our full disclaimer & terms of use and privacy policy.