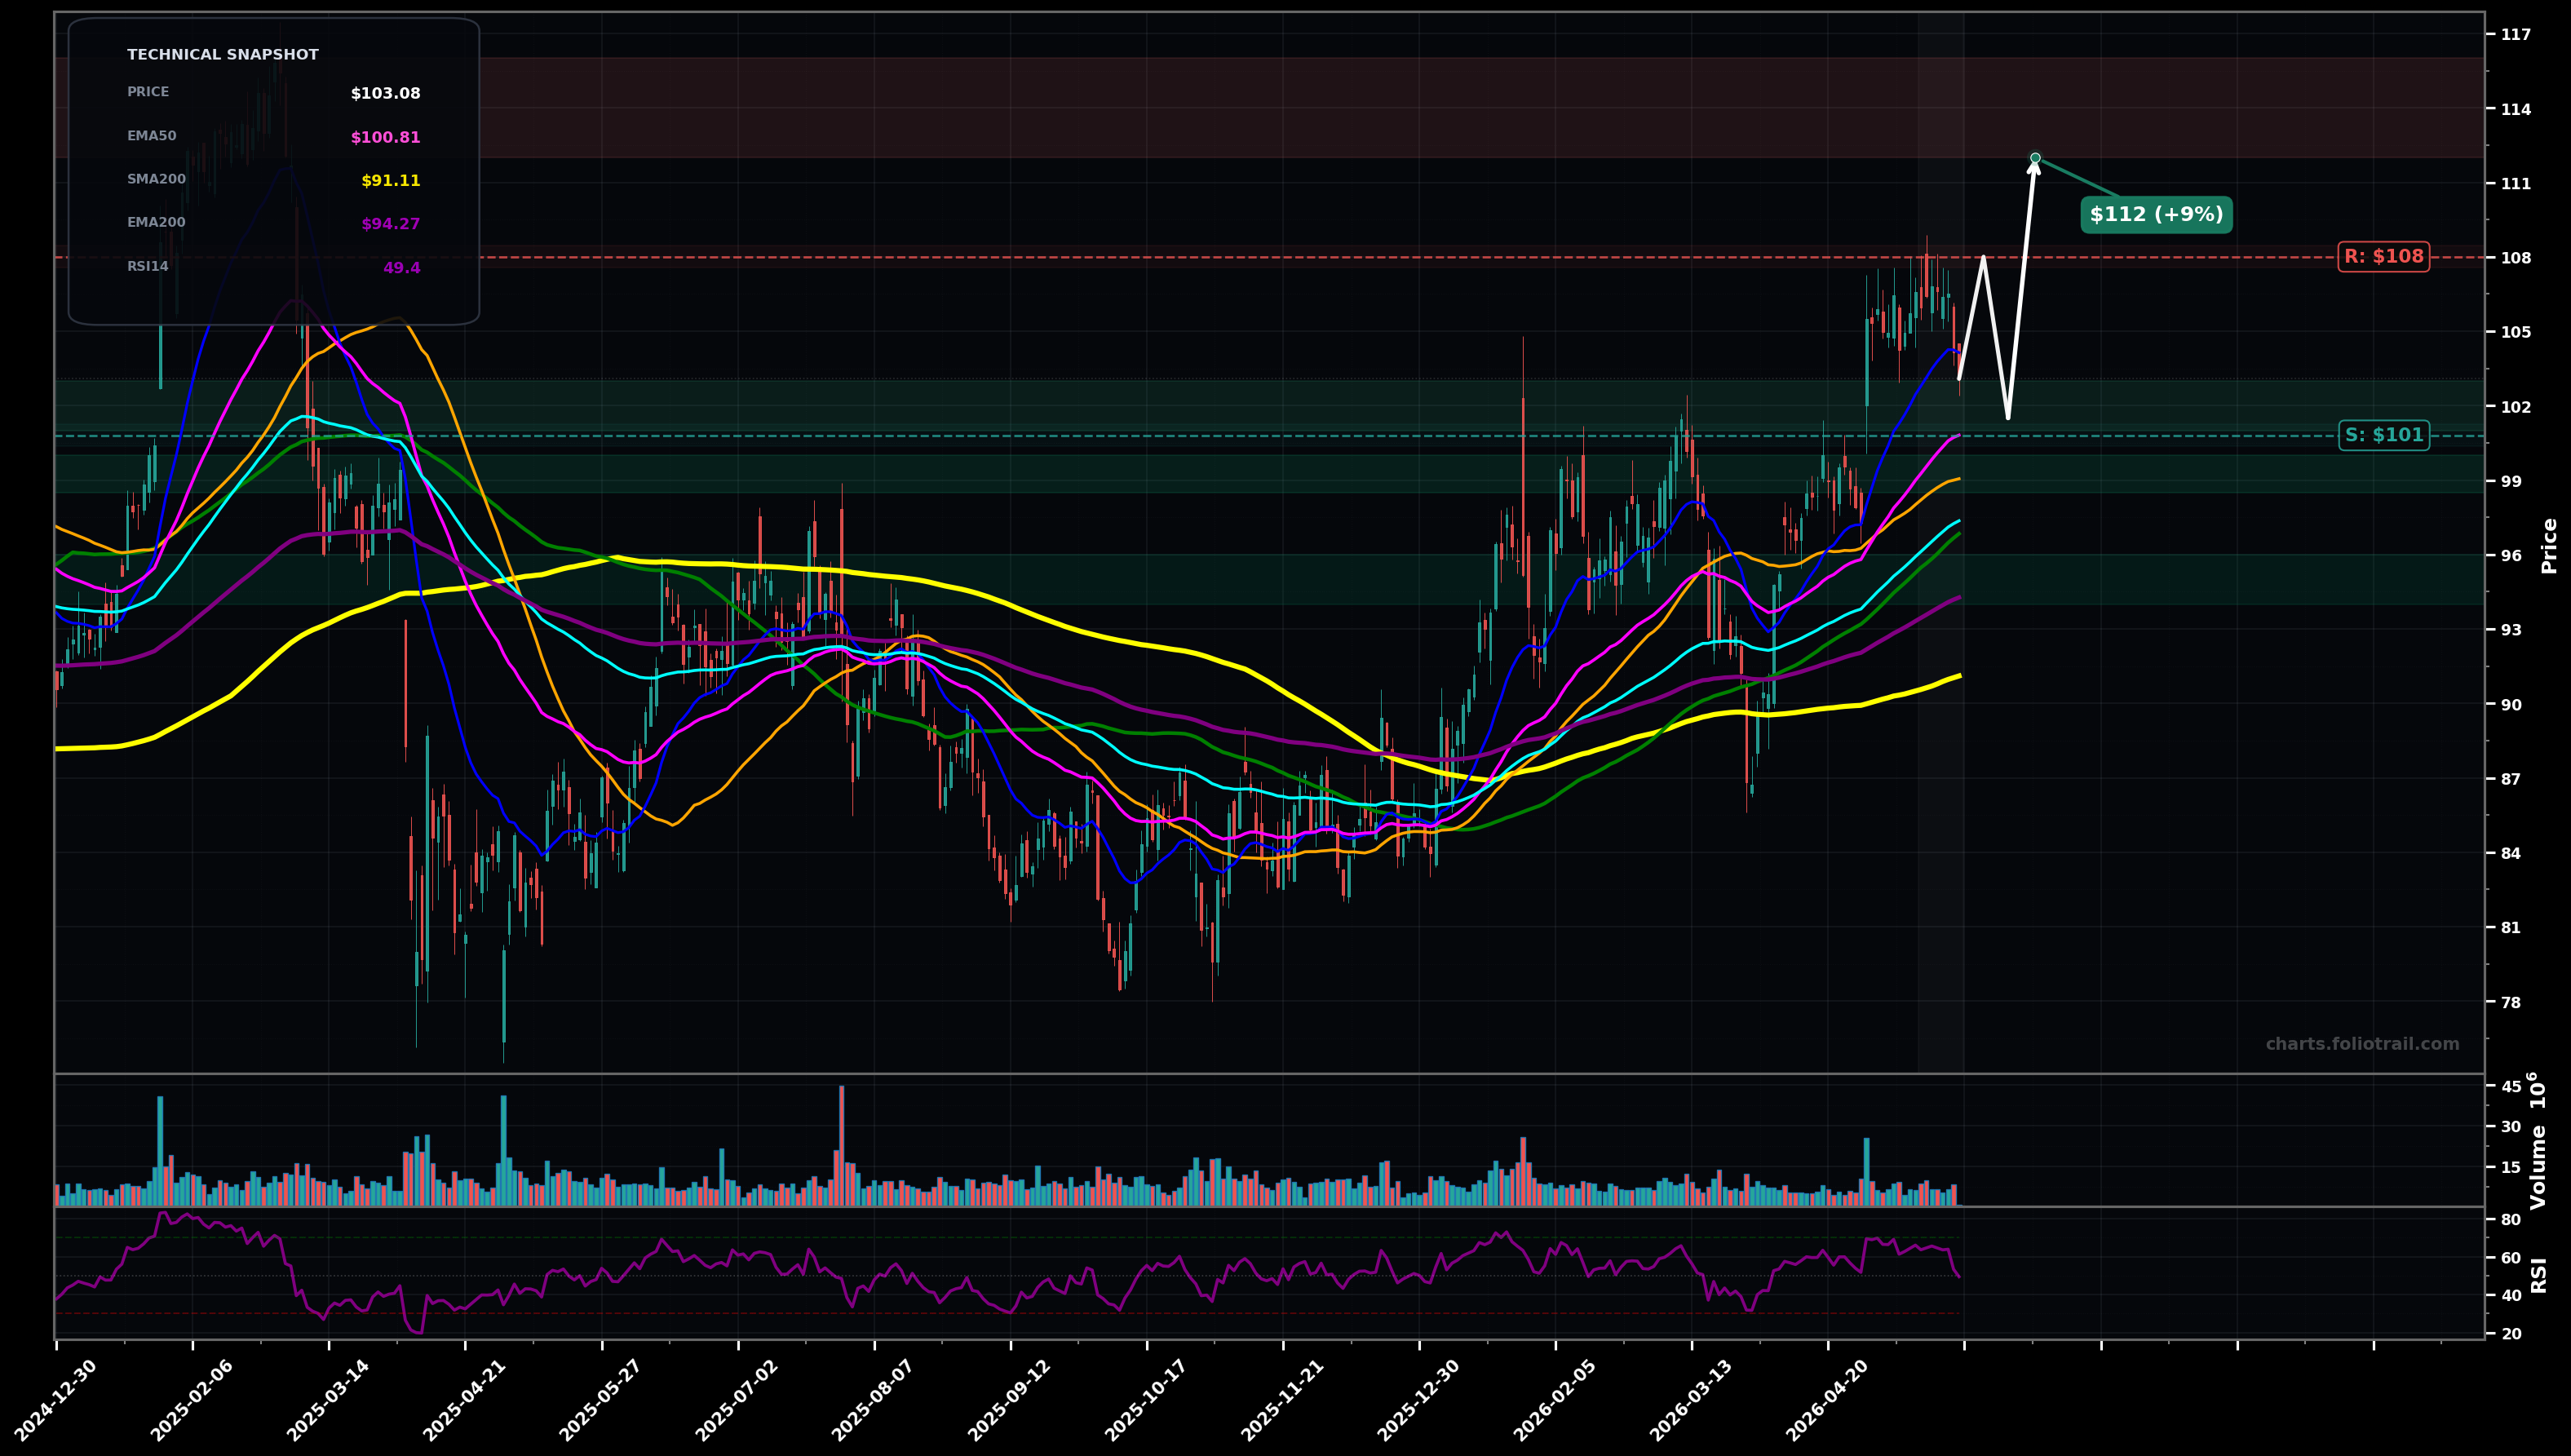
As of May 22, 2026, SBUX (Starbucks Corporation) is in a uptrend state on the daily chart, with a confidence level of 62%. Key support is at $101 and key resistance at $108. Pulled back from the ~$108 swing high into the ~$103 area after a strong run; price is still above rising EMA50/EMA100 but momentum cooled (RSI ~49).
Bullish pullback holds the EMA50/nearby $101-$100 zone, then price grinds higher to retest the prior swing high and extends to a measured breakout.
Deeper correction: loses EMA50 and slips into the prior consolidation/MA cluster (SMA50/EMA100), attempting to form a higher low; failure there risks a broader retrace toward the bigger MAs.
Daily close back above $105.50 with follow-through (2+ closes) holds the uptrend structure
Daily close below $100.80 (EMA50) followed by a break below $99.00 (SMA50) would signal trend damage
Start near EMA50 support, add on a controlled flush into EMA100/SMA100 area, heavy add only if a deeper fib/EMA200-type retest holds and prints a higher low.
Trim into likely wave (5) extension zones above the prior ~$108 high; progressively de-risk as price stretches far above EMA50/EMA100 and approaches prior-cycle resistance/extension areas.
As of May 22, 2026, SBUX (Starbucks Corporation) is in a uptrend state on the daily chart with 62% confidence. Pulled back from the ~$108 swing high into the ~$103 area after a strong run; price is still above rising EMA50/EMA100 but momentum cooled (RSI ~49).
On the daily timeframe, SBUX has key support at $101 and key resistance at $108. The most likely scenario (bullish) targets $108 and $112, with a revert level at $102.
SBUX (Starbucks Corporation) is currently classified as uptrend on the daily chart, with 62% confidence. Confirmation requires: Daily close back above $105.50 with follow-through (2+ closes) holds the uptrend structure This would be invalidated by: Daily close below $100.80 (EMA50) followed by a break below $99.00 (SMA50) would signal trend damage
The most likely scenario (bullish) targets $108 and $112, with a revert level at $102. The alternative scenario (bearish) targets $97.4 and $94.3.
Multi-layer AI agents analyse 200+ stocks across daily, weekly, and monthly timeframes — producing market state classifications, price scenarios with targets, and position entry/exit levels. Daily charts updated every trading day at 6 PM ET. Weekly charts refresh Fridays. Monthly charts refresh on the last trading day of each month. No paywall. No sign-up required.
Built by Foliotrail.
All content on this website — including charts, analysis, price targets, support/resistance levels, and position zones — is generated entirely by AI and provided for educational and informational purposes only.
This is not financial advice. NEXUSNOIR VENTURES SL (the operator of this website) is not a registered investment adviser or broker-dealer. You should not make investment decisions based solely on this information. Always do your own research and consult a qualified financial advisor.
By continuing, you acknowledge that you have read and agree to our full disclaimer & terms of use and privacy policy.