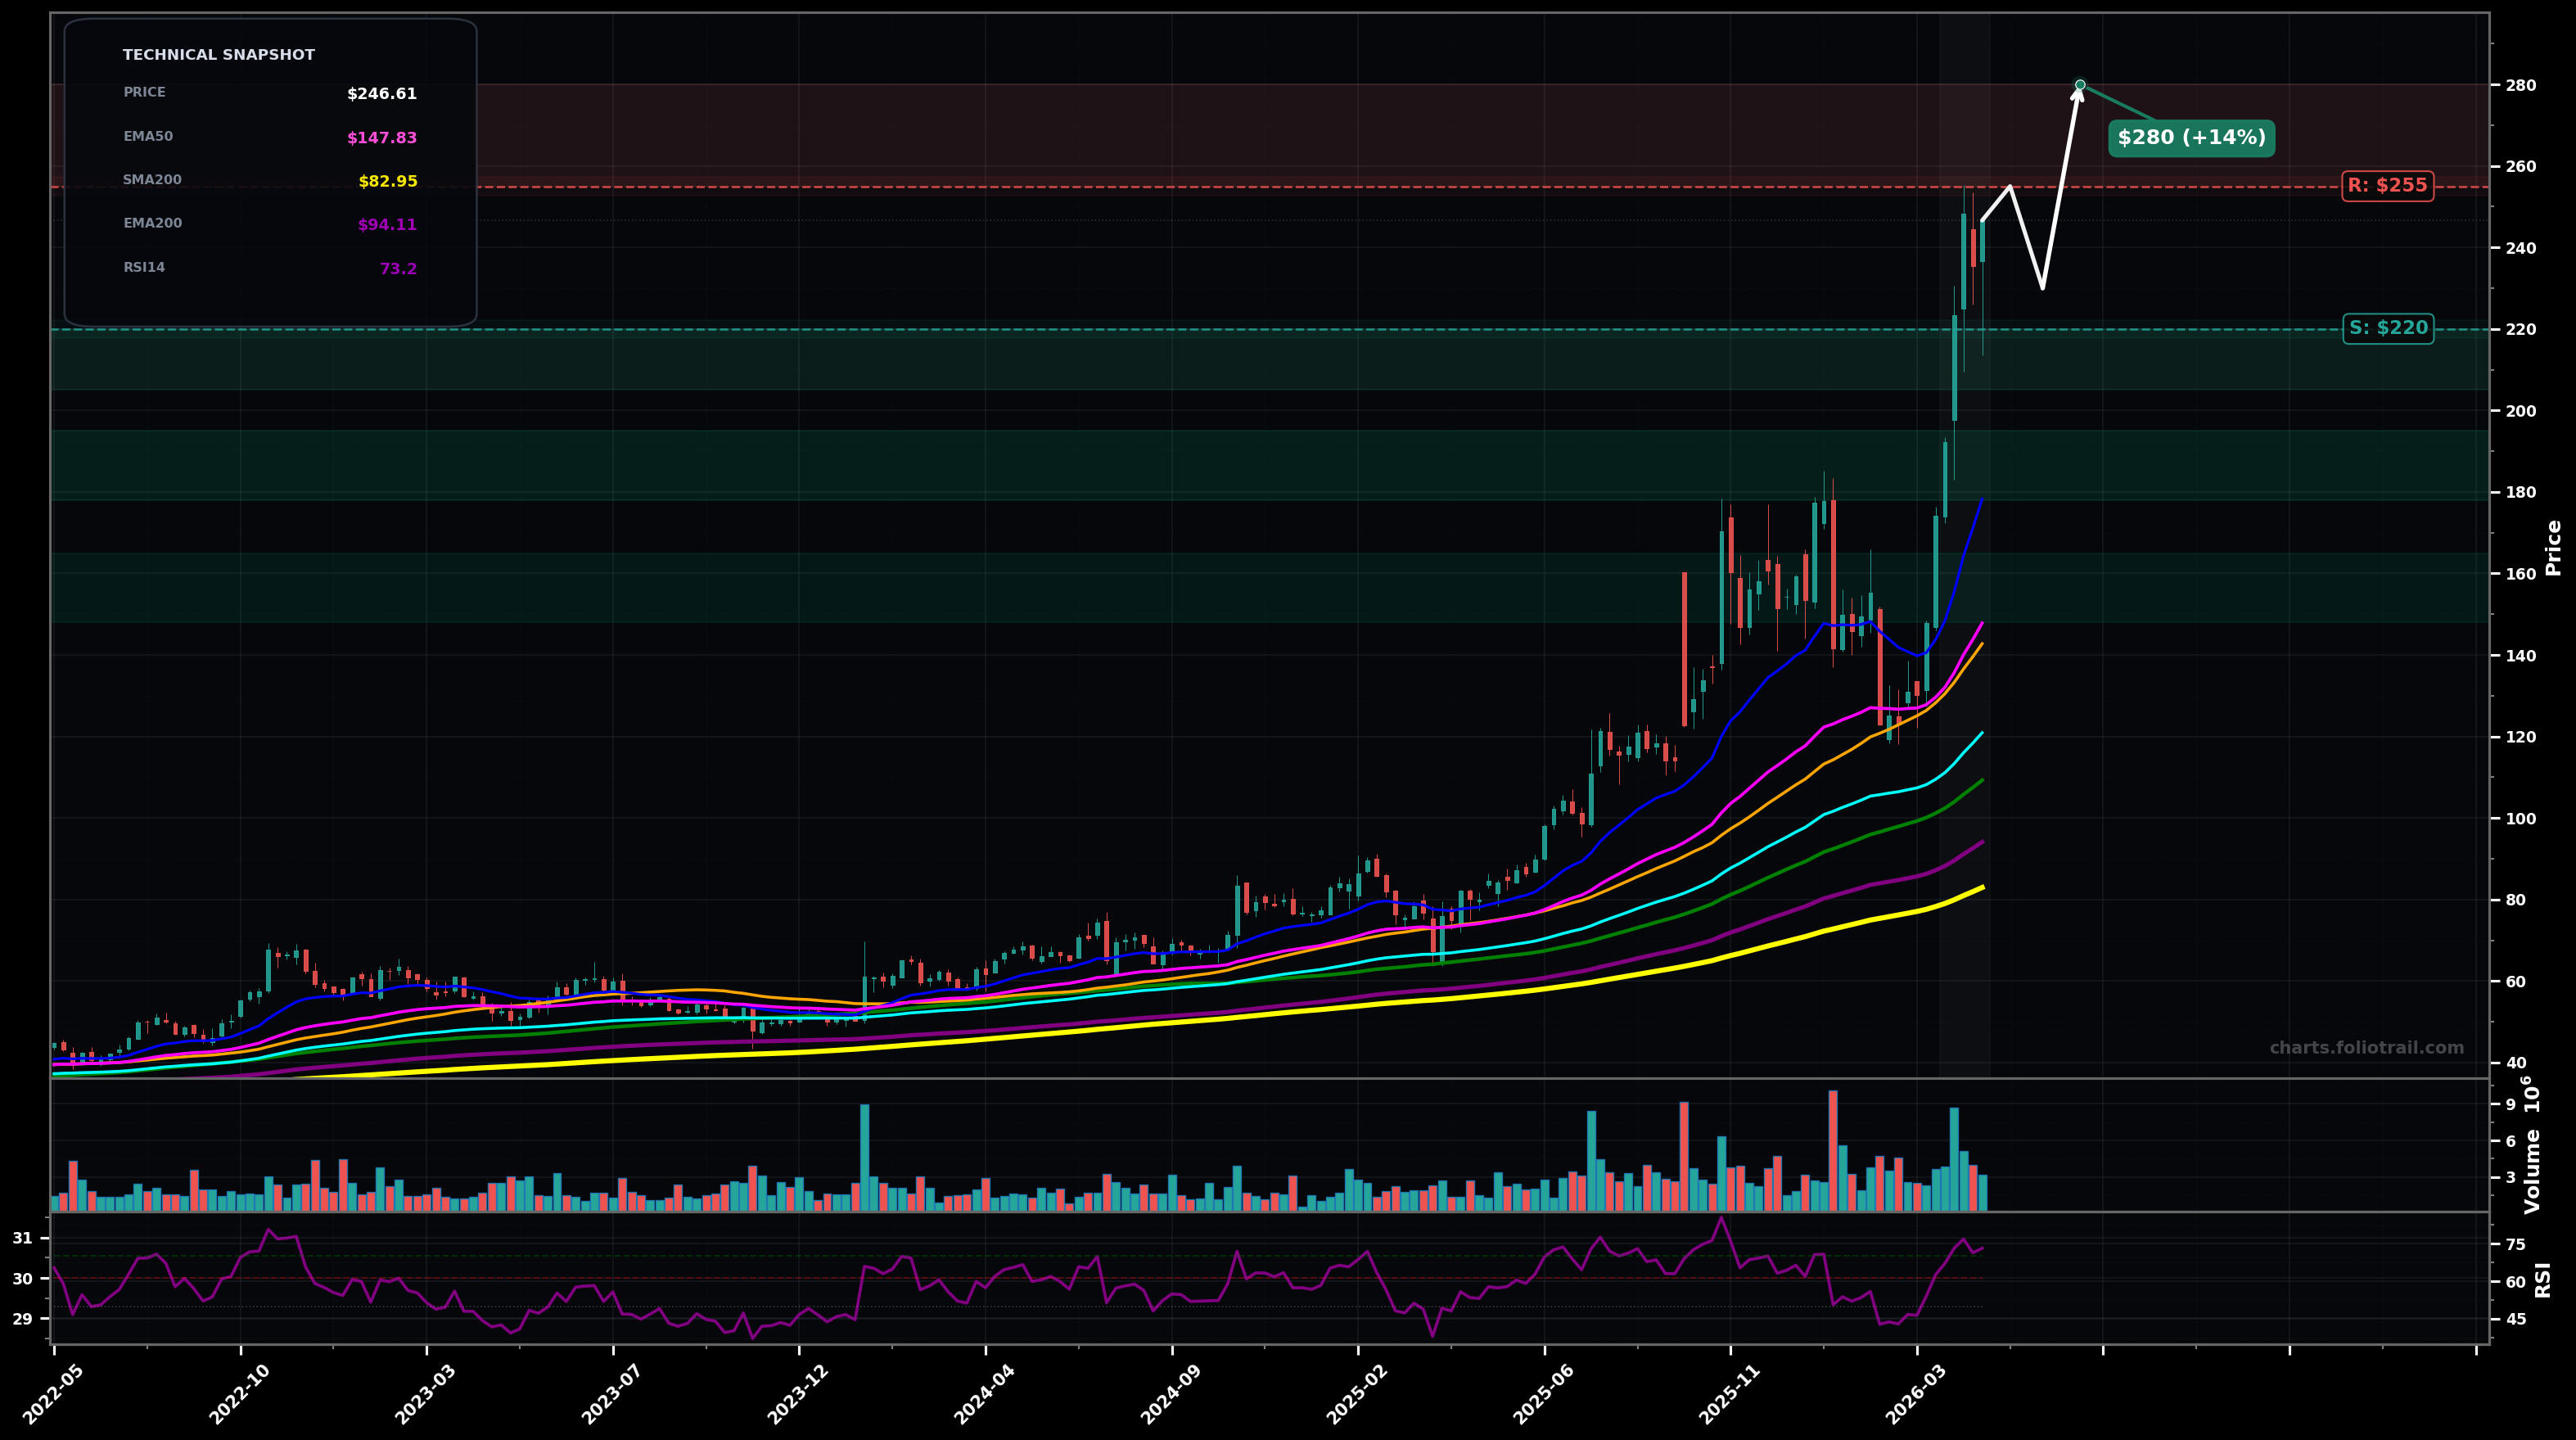
As of May 22, 2026, SANM (Sanmina Corporation) is in a parabolic state on the weekly chart, with a confidence level of 74%. Key support is at $220 and key resistance at $255. Weekly breakout to new highs followed by a tight pullback/consolidation near the top; price still well above all major MAs with RSI elevated (~73).
Shallow consolidation (bull flag) between ~$220-$255, then continuation higher as the impulse (likely Elliott Wave 5 extension) completes; watch for decreasing volatility on pullbacks and quick dips being bought.
Parabolic top/cooling: rejection near ~$250-$255 leads to a sharper mean-reversion toward the breakout base/fast MAs (typical Wave 4/ABC correction). A weekly break under ~$220 increases odds of a deeper retrace.
Weekly close above $255 with follow-through would confirm continued parabola/impulse extension
Weekly close below $220 would invalidate the parabolic continuation and signal a deeper correction phase
Buy-the-dip zones are aligned with prior breakout shelf (~$205-$220), then likely Fibonacci retrace region into the $180s, with a deeper wash targeting the rising EMA50 (~$148) / prior structure if a larger ABC unfolds.
Price is extremely extended vs EMA50/EMA100; trims are staged into potential Wave-5/fib extensions above prior highs, where upside continues but drawdown risk rises sharply if momentum fades.
As of May 22, 2026, SANM (Sanmina Corporation) is in a parabolic state on the weekly chart with 74% confidence. Weekly breakout to new highs followed by a tight pullback/consolidation near the top; price still well above all major MAs with RSI elevated (~73).
On the weekly timeframe, SANM has key support at $220 and key resistance at $255. The most likely scenario (bullish) targets $255 and $280, with a revert level at $230.
SANM (Sanmina Corporation) is currently classified as parabolic on the weekly chart, with 74% confidence. Confirmation requires: Weekly close above $255 with follow-through would confirm continued parabola/impulse extension This would be invalidated by: Weekly close below $220 would invalidate the parabolic continuation and signal a deeper correction phase
The most likely scenario (bullish) targets $255 and $280, with a revert level at $230. The alternative scenario (bearish) targets $205 and $178.
Multi-layer AI agents analyse 200+ stocks across daily, weekly, and monthly timeframes — producing market state classifications, price scenarios with targets, and position entry/exit levels. Daily charts updated every trading day at 6 PM ET. Weekly charts refresh Fridays. Monthly charts refresh on the last trading day of each month. No paywall. No sign-up required.
Built by Foliotrail.
All content on this website — including charts, analysis, price targets, support/resistance levels, and position zones — is generated entirely by AI and provided for educational and informational purposes only.
This is not financial advice. NEXUSNOIR VENTURES SL (the operator of this website) is not a registered investment adviser or broker-dealer. You should not make investment decisions based solely on this information. Always do your own research and consult a qualified financial advisor.
By continuing, you acknowledge that you have read and agree to our full disclaimer & terms of use and privacy policy.