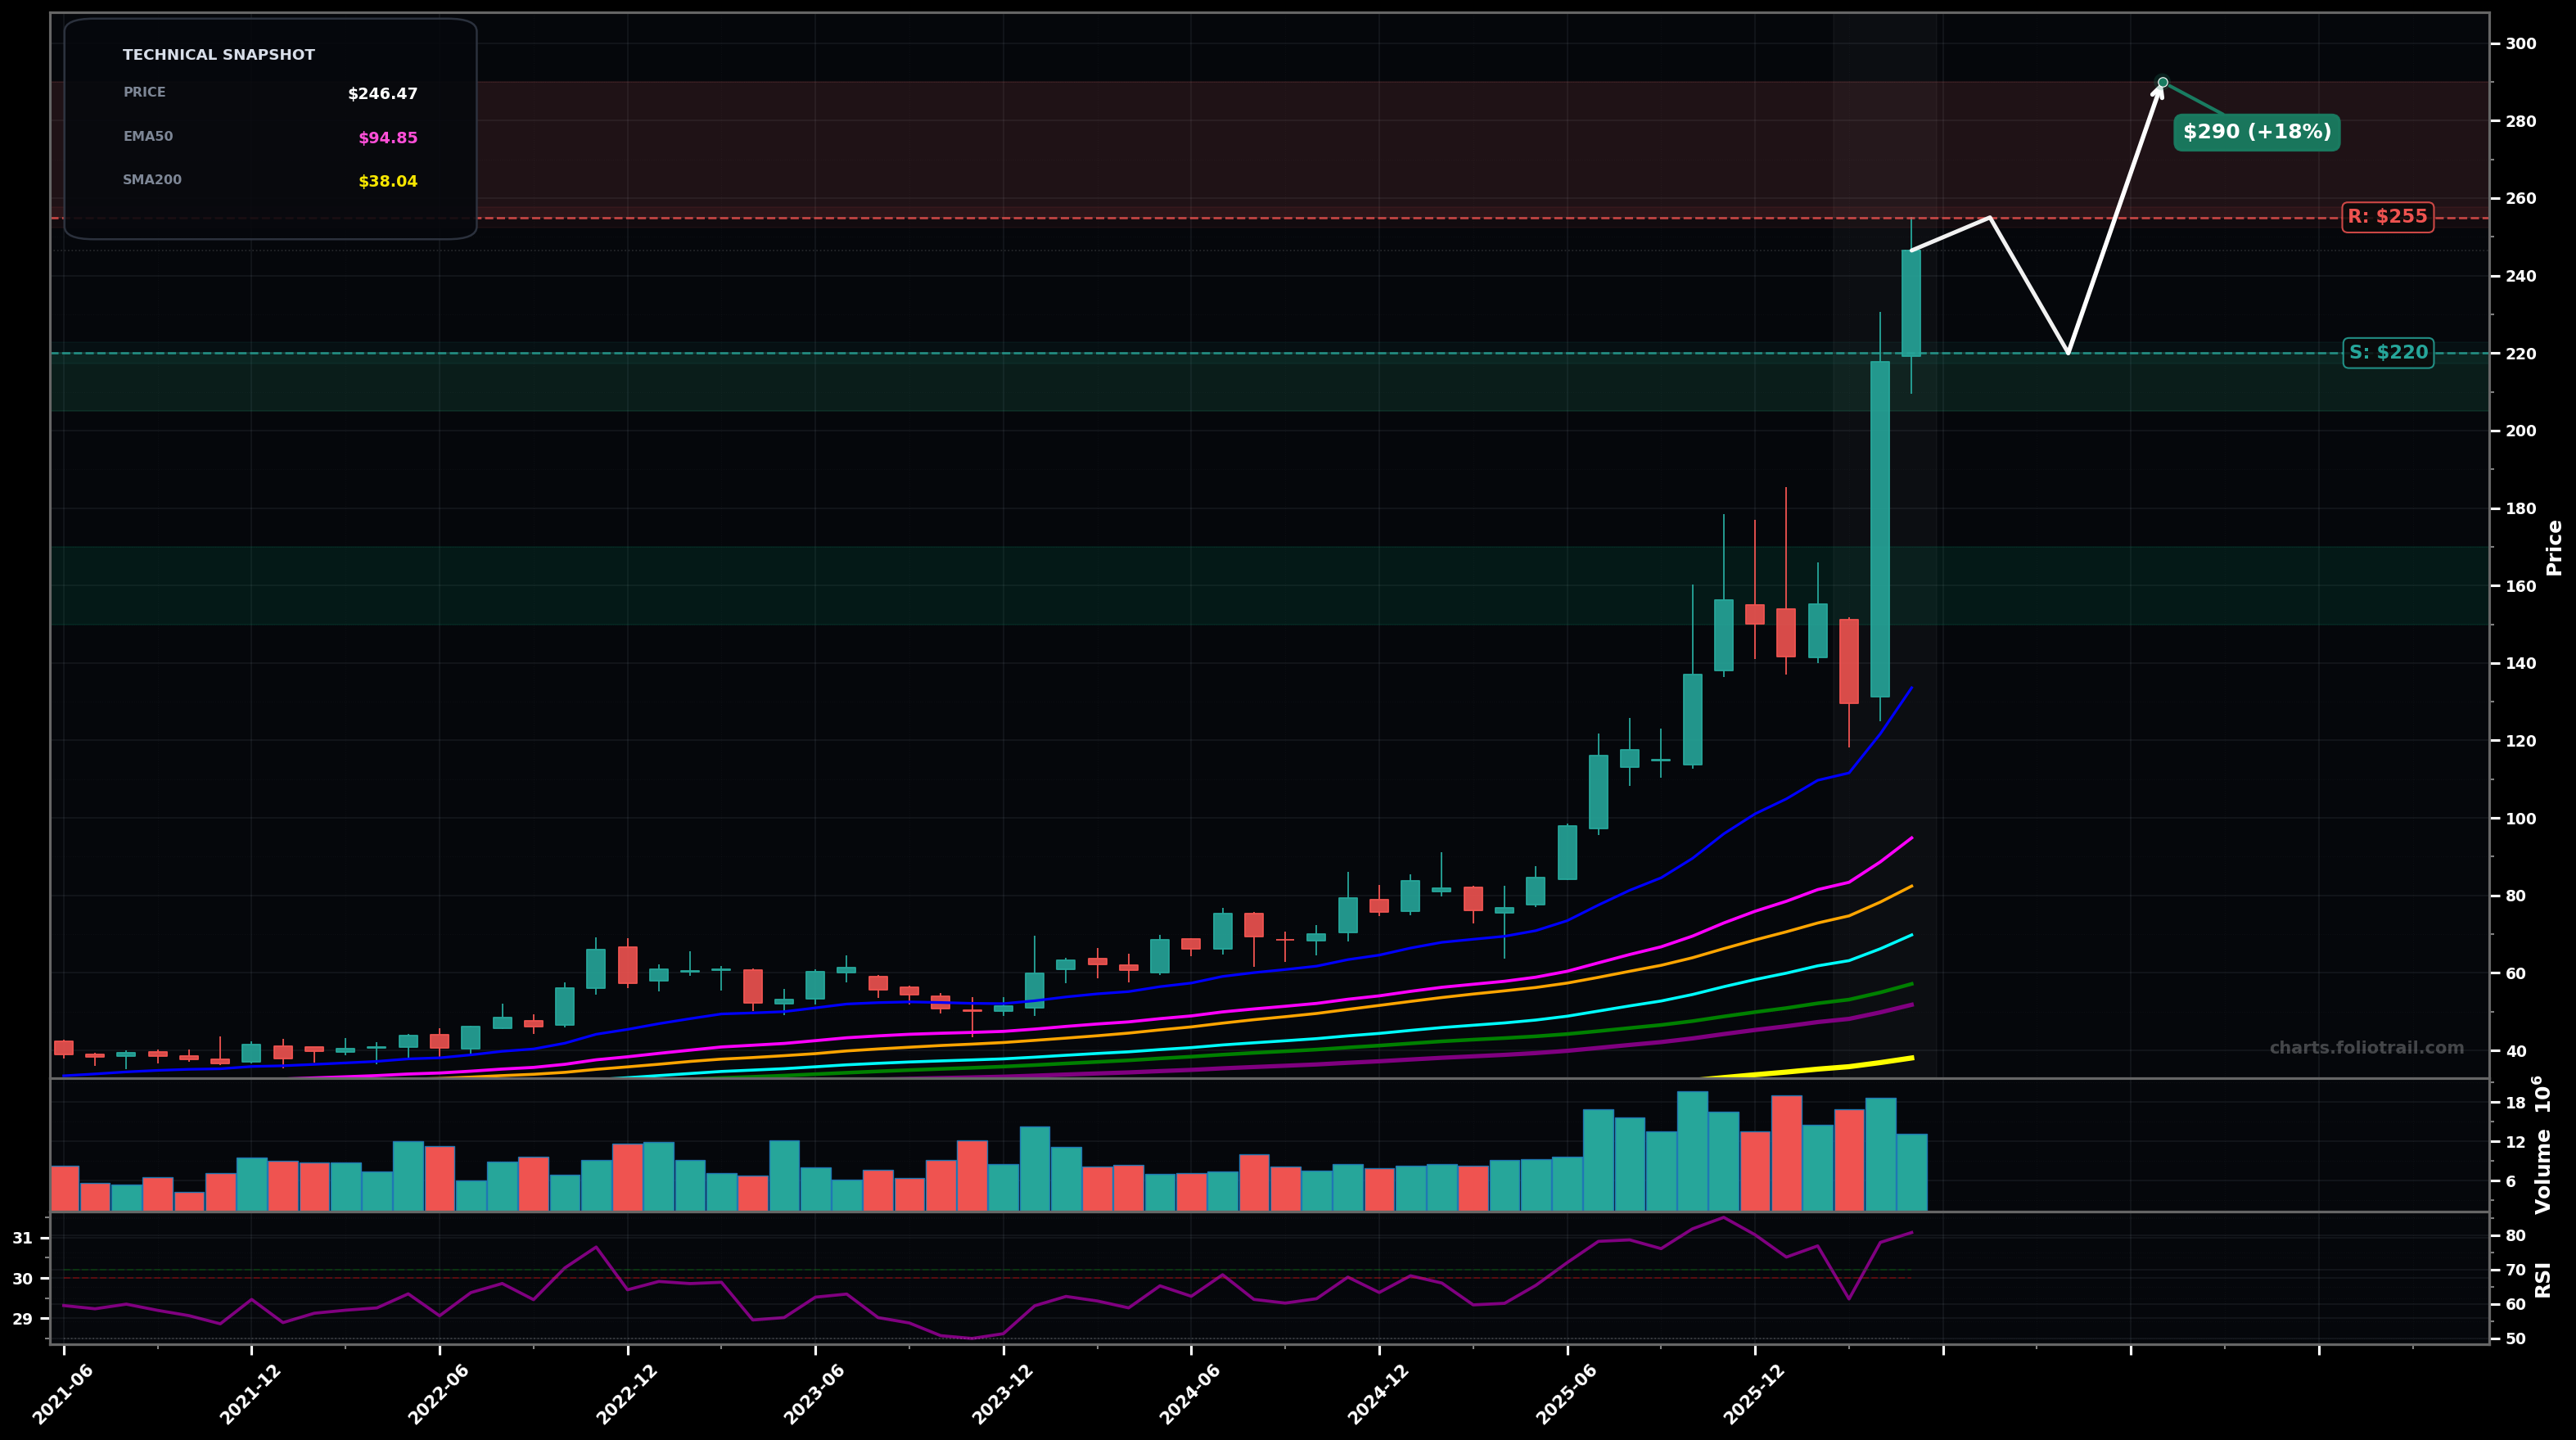
As of May 22, 2026, SANM (Sanmina Corporation) is in a parabolic state on the monthly chart, with a confidence level of 74%. Key support is at $220 and key resistance at $255. Monthly has a sharp impulsive breakout to ~$246.47 after a prior consolidation near $140-$170; price is far above all key MAs with RSI~80.8 (overbought) and volatility expanding.
Continuation with a controlled pullback/flag: price digests above the breakout zone ($220-$200) then makes another push higher (parabolic continuation but with higher pullback risk).
Blow-off top then mean-reversion: a sharp rejection (large red close near lows) triggers a deeper retrace toward the breakout base and fast MAs before any new highs attempt.
Monthly close holding above $220 with no large red close near lows
Monthly close below $210 (break back under breakout thrust + prior swing zone)
Buy-the-dip only: $205-$220 is breakout retest support; $180-$200 is deeper retrace into prior congestion; $150-$170 aligns with the pre-breakout range/swing structure if a full mean-reversion occurs.
Trim into extension: price is extremely stretched above EMA50/100/200 and RSI is overbought; scale out at successive fib-extension style zones rather than expecting a straight line continuation.
As of May 22, 2026, SANM (Sanmina Corporation) is in a parabolic state on the monthly chart with 74% confidence. Monthly has a sharp impulsive breakout to ~$246.47 after a prior consolidation near $140-$170; price is far above all key MAs with RSI~80.8 (overbought) and volatility expanding.
On the monthly timeframe, SANM has key support at $220 and key resistance at $255. The most likely scenario (bullish) targets $255 and $290, with a revert level at $220.
SANM (Sanmina Corporation) is currently classified as parabolic on the monthly chart, with 74% confidence. Confirmation requires: Monthly close holding above $220 with no large red close near lows This would be invalidated by: Monthly close below $210 (break back under breakout thrust + prior swing zone)
The most likely scenario (bullish) targets $255 and $290, with a revert level at $220. The alternative scenario (bearish) targets $200 and $170.
Multi-layer AI agents analyse 200+ stocks across daily, weekly, and monthly timeframes — producing market state classifications, price scenarios with targets, and position entry/exit levels. Daily charts updated every trading day at 6 PM ET. Weekly charts refresh Fridays. Monthly charts refresh on the last trading day of each month. No paywall. No sign-up required.
Built by Foliotrail.
All content on this website — including charts, analysis, price targets, support/resistance levels, and position zones — is generated entirely by AI and provided for educational and informational purposes only.
This is not financial advice. NEXUSNOIR VENTURES SL (the operator of this website) is not a registered investment adviser or broker-dealer. You should not make investment decisions based solely on this information. Always do your own research and consult a qualified financial advisor.
By continuing, you acknowledge that you have read and agree to our full disclaimer & terms of use and privacy policy.