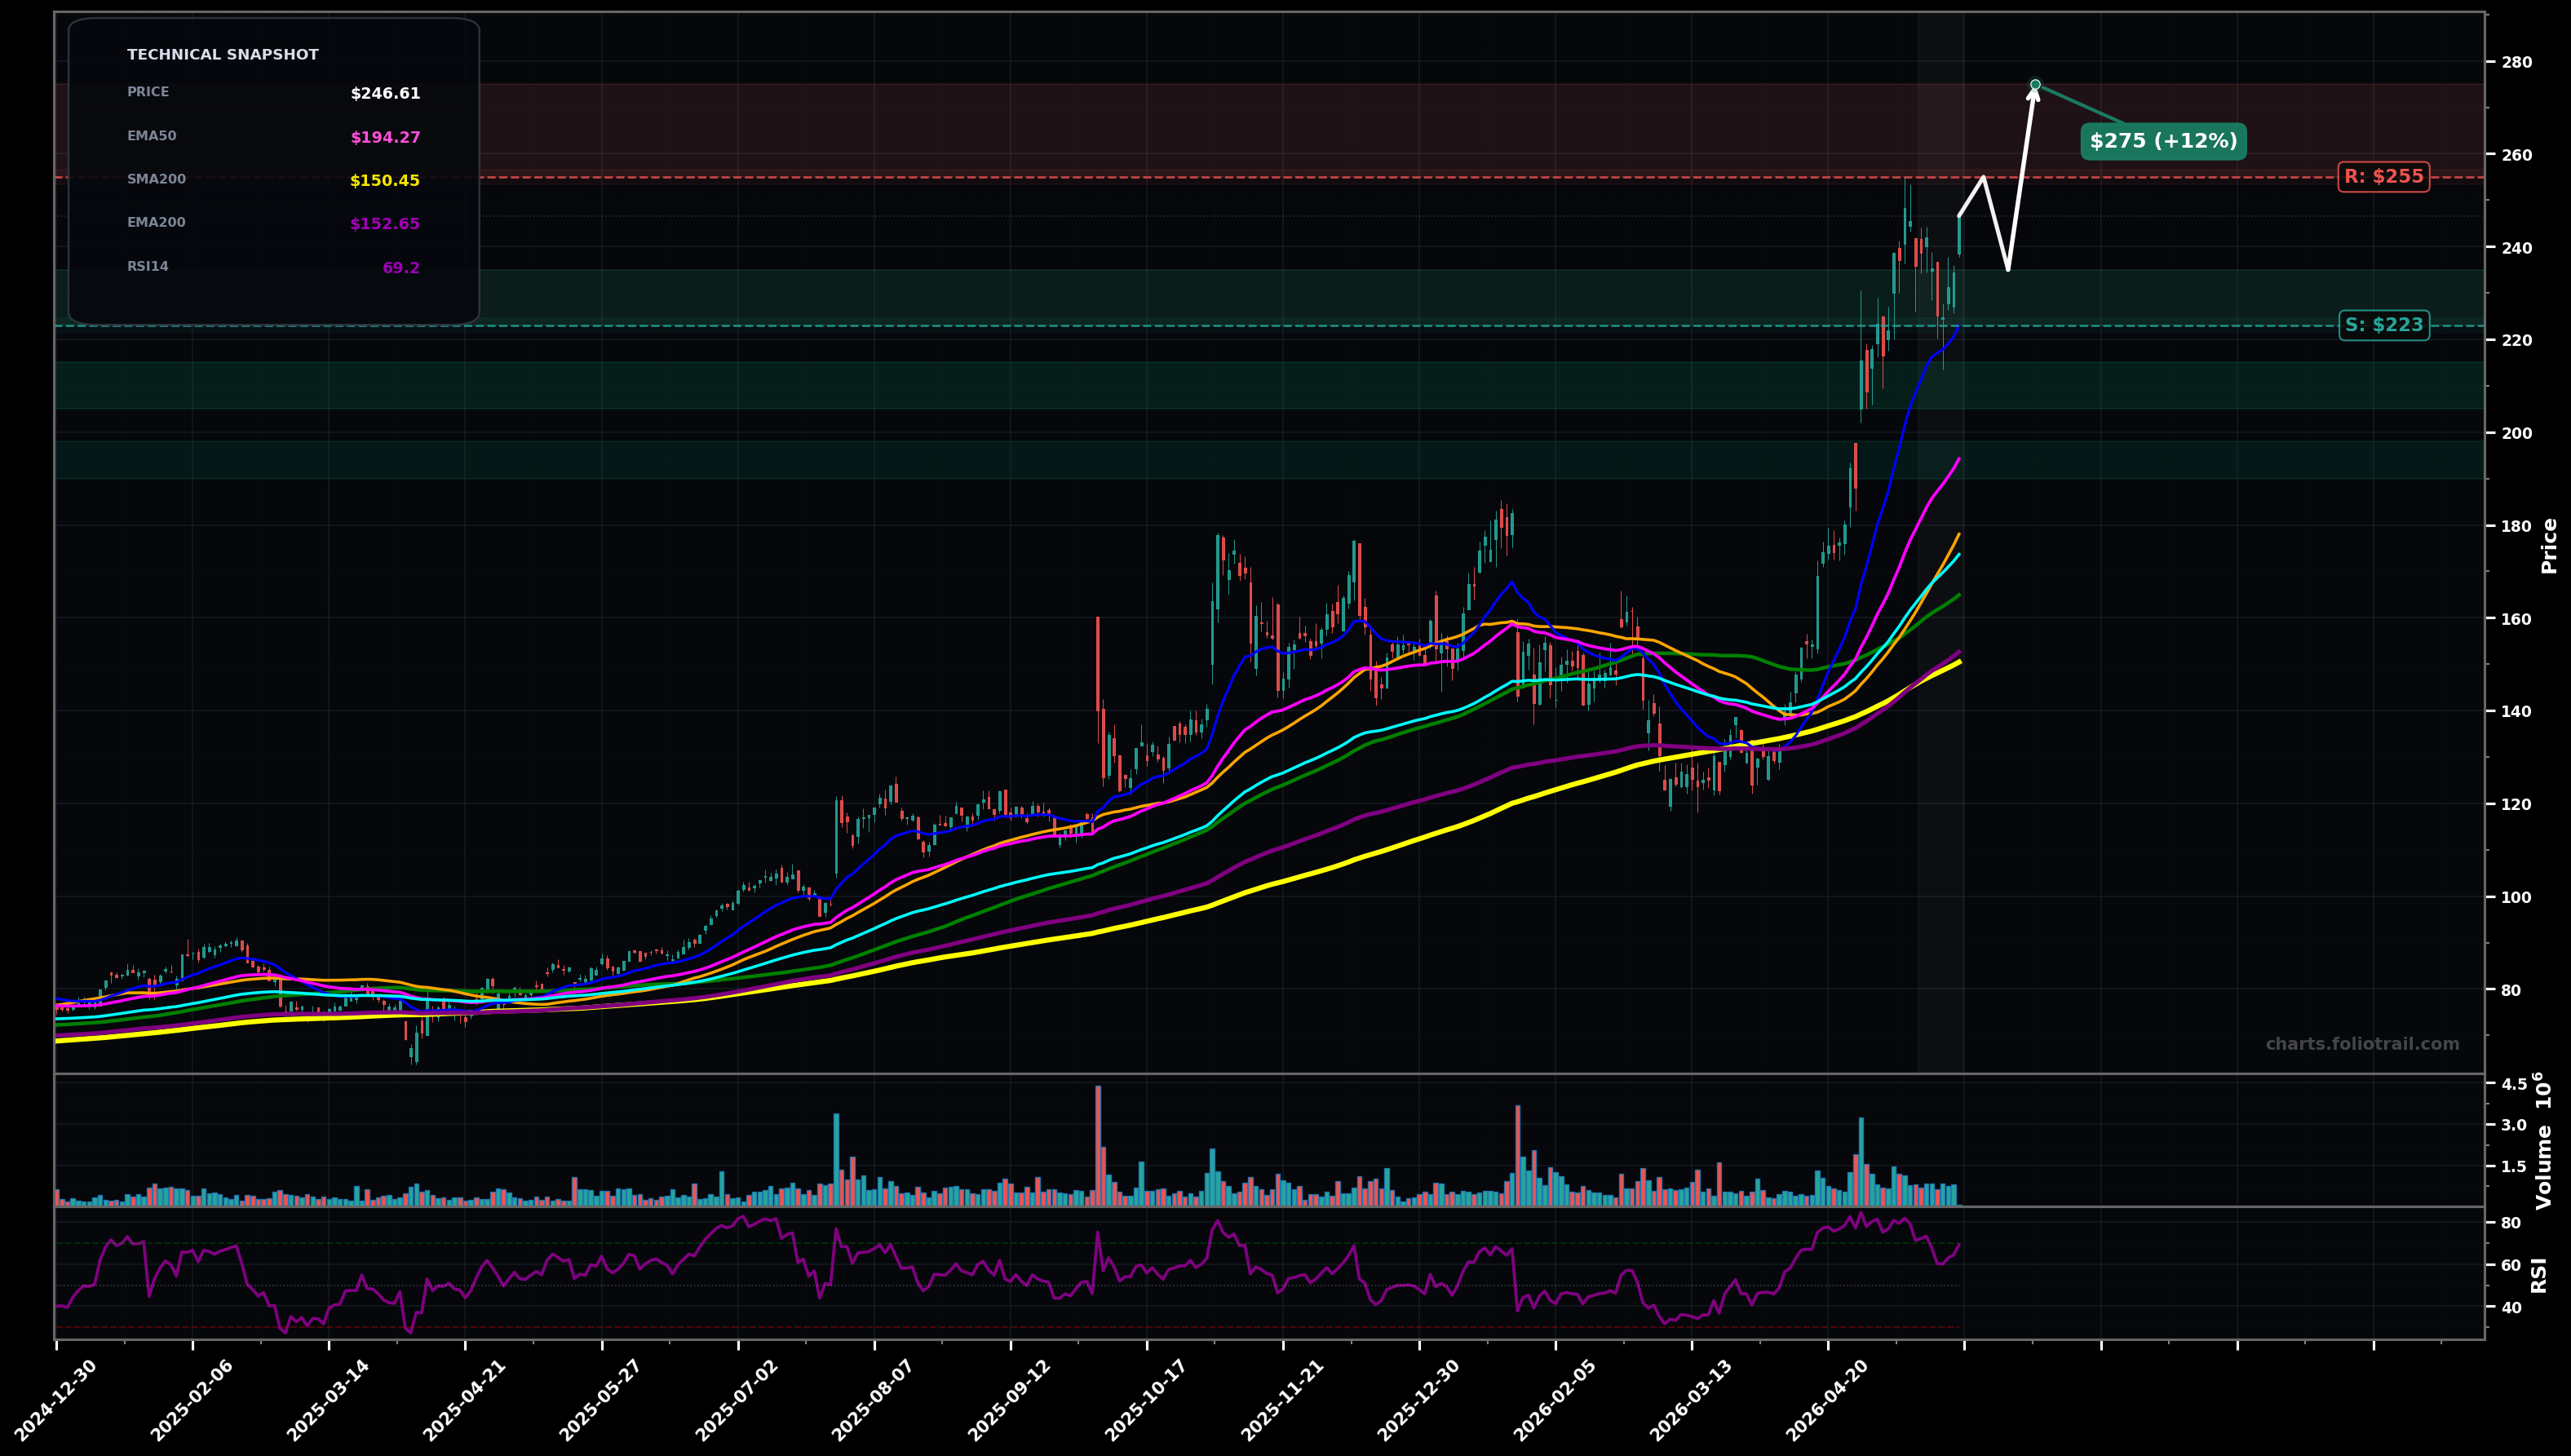
As of May 22, 2026, SANM (Sanmina Corporation) is in a parabolic state on the daily chart, with a confidence level of 71%. Key support is at $223 and key resistance at $255. Price at $246.61 after a strong breakout run; recent pullback/consolidation near highs while holding well above rising short/mid MAs (RSI~69).
Bullish continuation: shallow pullback holds above $223 then attempts breakout to new highs (likely Wave 5 extension / continuation of impulsive leg).
Bearish mean-reversion: failure near $255 leads to deeper retrace toward the rising EMA50/previous breakout zone; still a bull-trend pullback unless $194 breaks.
Daily close above $255 with follow-through (2+ closes holding)
Daily close below $223 (loss of EMA20 area and prior pivot support)
Buy zones clustered at swing-low reference/EMA20 ($223) then mean-reversion to EMA50 (~$194) and nearby prior breakout structure; invalidation below ~$190 increases odds the parabolic leg is fully unwinding.
Trim into overhead breakout/extension ($255+) as RSI/price are stretched above EMA50/100; heavier trims on further extension where odds favor a larger ABC/Wave-4 style retrace back toward EMA50/100.
As of May 22, 2026, SANM (Sanmina Corporation) is in a parabolic state on the daily chart with 71% confidence. Price at $246.61 after a strong breakout run; recent pullback/consolidation near highs while holding well above rising short/mid MAs (RSI~69).
On the daily timeframe, SANM has key support at $223 and key resistance at $255. The most likely scenario (bullish) targets $255 and $275, with a revert level at $235.
SANM (Sanmina Corporation) is currently classified as parabolic on the daily chart, with 71% confidence. Confirmation requires: Daily close above $255 with follow-through (2+ closes holding) This would be invalidated by: Daily close below $223 (loss of EMA20 area and prior pivot support)
The most likely scenario (bullish) targets $255 and $275, with a revert level at $235. The alternative scenario (bearish) targets $223 and $195.
Multi-layer AI agents analyse 200+ stocks across daily, weekly, and monthly timeframes — producing market state classifications, price scenarios with targets, and position entry/exit levels. Daily charts updated every trading day at 6 PM ET. Weekly charts refresh Fridays. Monthly charts refresh on the last trading day of each month. No paywall. No sign-up required.
Built by Foliotrail.
All content on this website — including charts, analysis, price targets, support/resistance levels, and position zones — is generated entirely by AI and provided for educational and informational purposes only.
This is not financial advice. NEXUSNOIR VENTURES SL (the operator of this website) is not a registered investment adviser or broker-dealer. You should not make investment decisions based solely on this information. Always do your own research and consult a qualified financial advisor.
By continuing, you acknowledge that you have read and agree to our full disclaimer & terms of use and privacy policy.