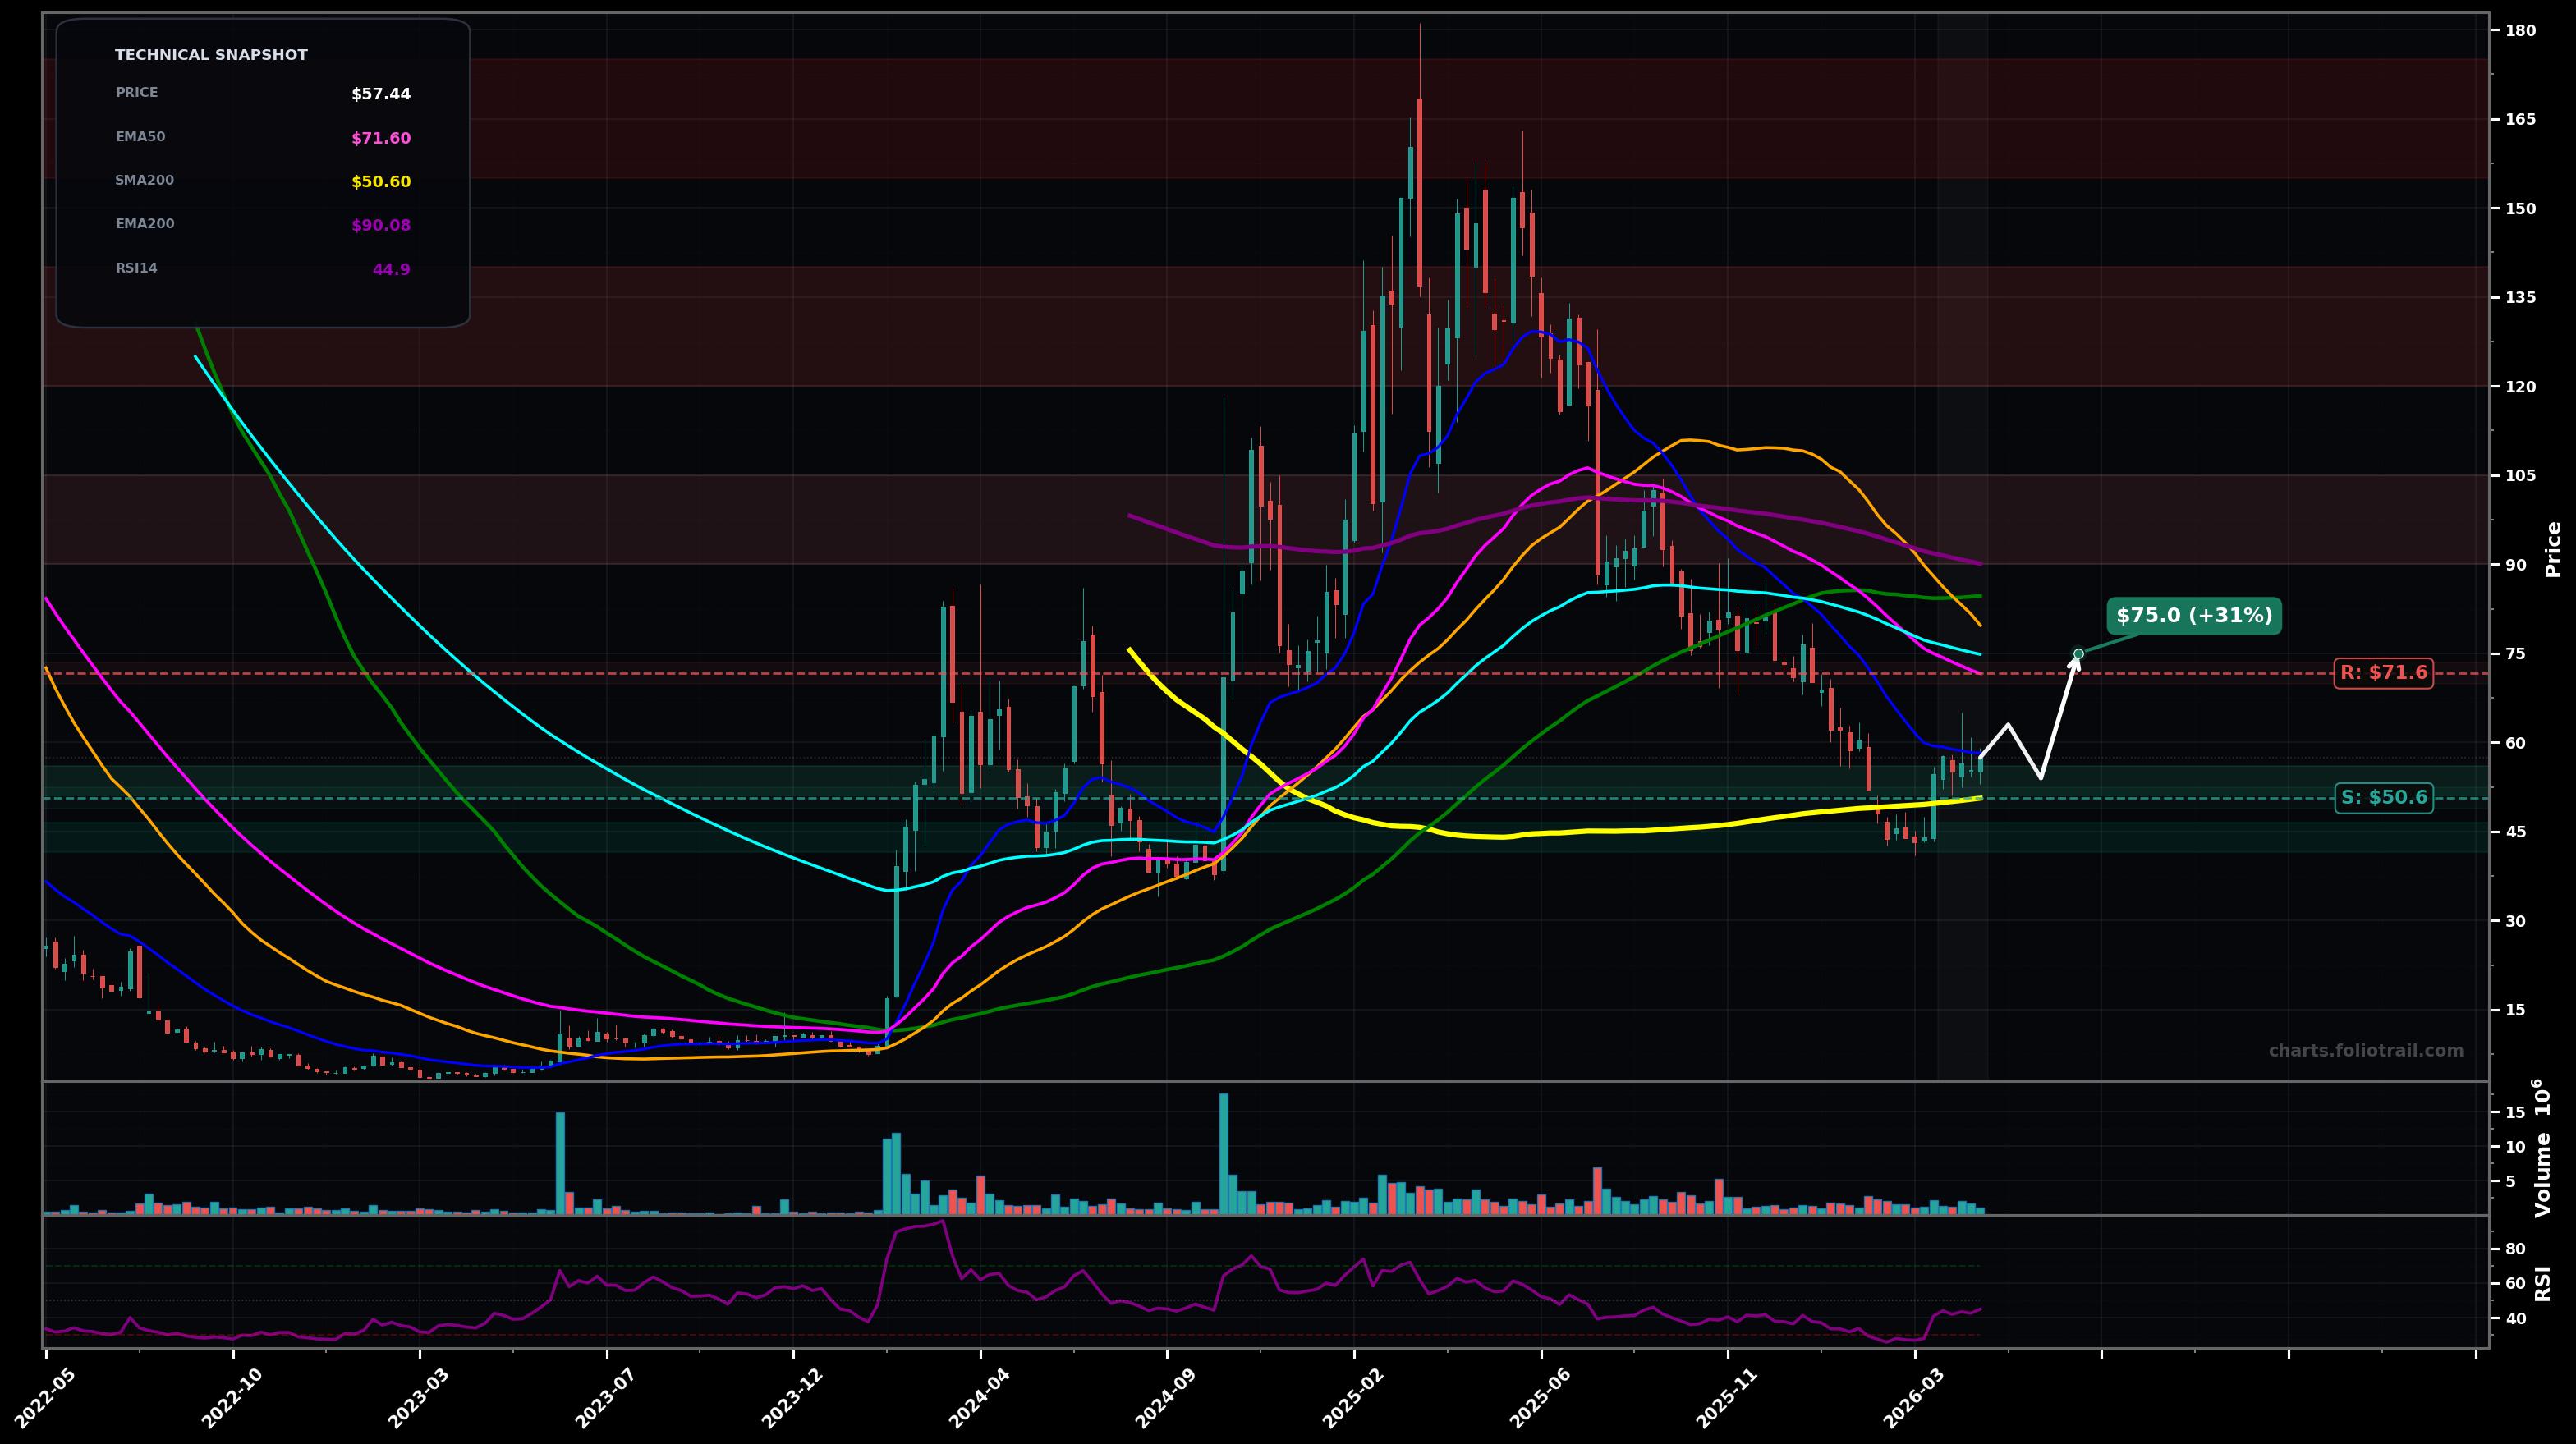
As of May 22, 2026, ROOT (Root, Inc. Class A Common Stock) is in a bottoming attempt state on the weekly chart, with a confidence level of 62%. Key support is at $50.6 and key resistance at $71.6. Weekly bounce off the ~$45-$50 base (near SMA200) with price at ~$57.44, but still below the key downtrend MAs (EMA50/EMA100).
Base-building continues: price chops above SMA200 and works toward a mean-reversion move into the declining EMA50/EMA100 cluster; this fits an Elliott-style corrective phase (wave (2)/(B)) after a larger decline from the ~$160+ peak, with a typical Fib retrace magnet around the 38.2% area of the last downswing.
Bear continuation: the bounce fails under EMA50/EMA100, rolls over, and retests/breaks the SMA200 base; if that support gives way, price likely seeks the next demand pocket from the prior consolidation area (Fib extension/previous structure) in the low-$40s.
Weekly close above $71.60 (EMA50) with a second close holding above it
Weekly close below $49.50 (loss of SMA200 zone)
Scale near the SMA200/structure support first, add on a controlled retest, and only heavy-add if a deeper flush reaches prior demand (but avoid if weekly closes lose $49.50 decisively).
Trim into major MA/structure overhead (EMA200/SMA100/SMA50 region and prior breakdown areas), and close near the prior blow-off supply zone from the ~$160+ top where long-term RR typically degrades.
As of May 22, 2026, ROOT (Root, Inc. Class A Common Stock) is in a bottoming attempt state on the weekly chart with 62% confidence. Weekly bounce off the ~$45-$50 base (near SMA200) with price at ~$57.44, but still below the key downtrend MAs (EMA50/EMA100).
On the weekly timeframe, ROOT has key support at $50.6 and key resistance at $71.6. The most likely scenario (bullish) targets $63.0 and $75.0, with a revert level at $54.0.
ROOT (Root, Inc. Class A Common Stock) is currently classified as bottoming attempt on the weekly chart, with 62% confidence. Confirmation requires: Weekly close above $71.60 (EMA50) with a second close holding above it This would be invalidated by: Weekly close below $49.50 (loss of SMA200 zone)
The most likely scenario (bullish) targets $63.0 and $75.0, with a revert level at $54.0. The alternative scenario (bearish) targets $50.0 and $42.0.
Multi-layer AI agents analyse 200+ stocks across daily, weekly, and monthly timeframes — producing market state classifications, price scenarios with targets, and position entry/exit levels. Daily charts updated every trading day at 6 PM ET. Weekly charts refresh Fridays. Monthly charts refresh on the last trading day of each month. No paywall. No sign-up required.
Built by Foliotrail.
All content on this website — including charts, analysis, price targets, support/resistance levels, and position zones — is generated entirely by AI and provided for educational and informational purposes only.
This is not financial advice. NEXUSNOIR VENTURES SL (the operator of this website) is not a registered investment adviser or broker-dealer. You should not make investment decisions based solely on this information. Always do your own research and consult a qualified financial advisor.
By continuing, you acknowledge that you have read and agree to our full disclaimer & terms of use and privacy policy.