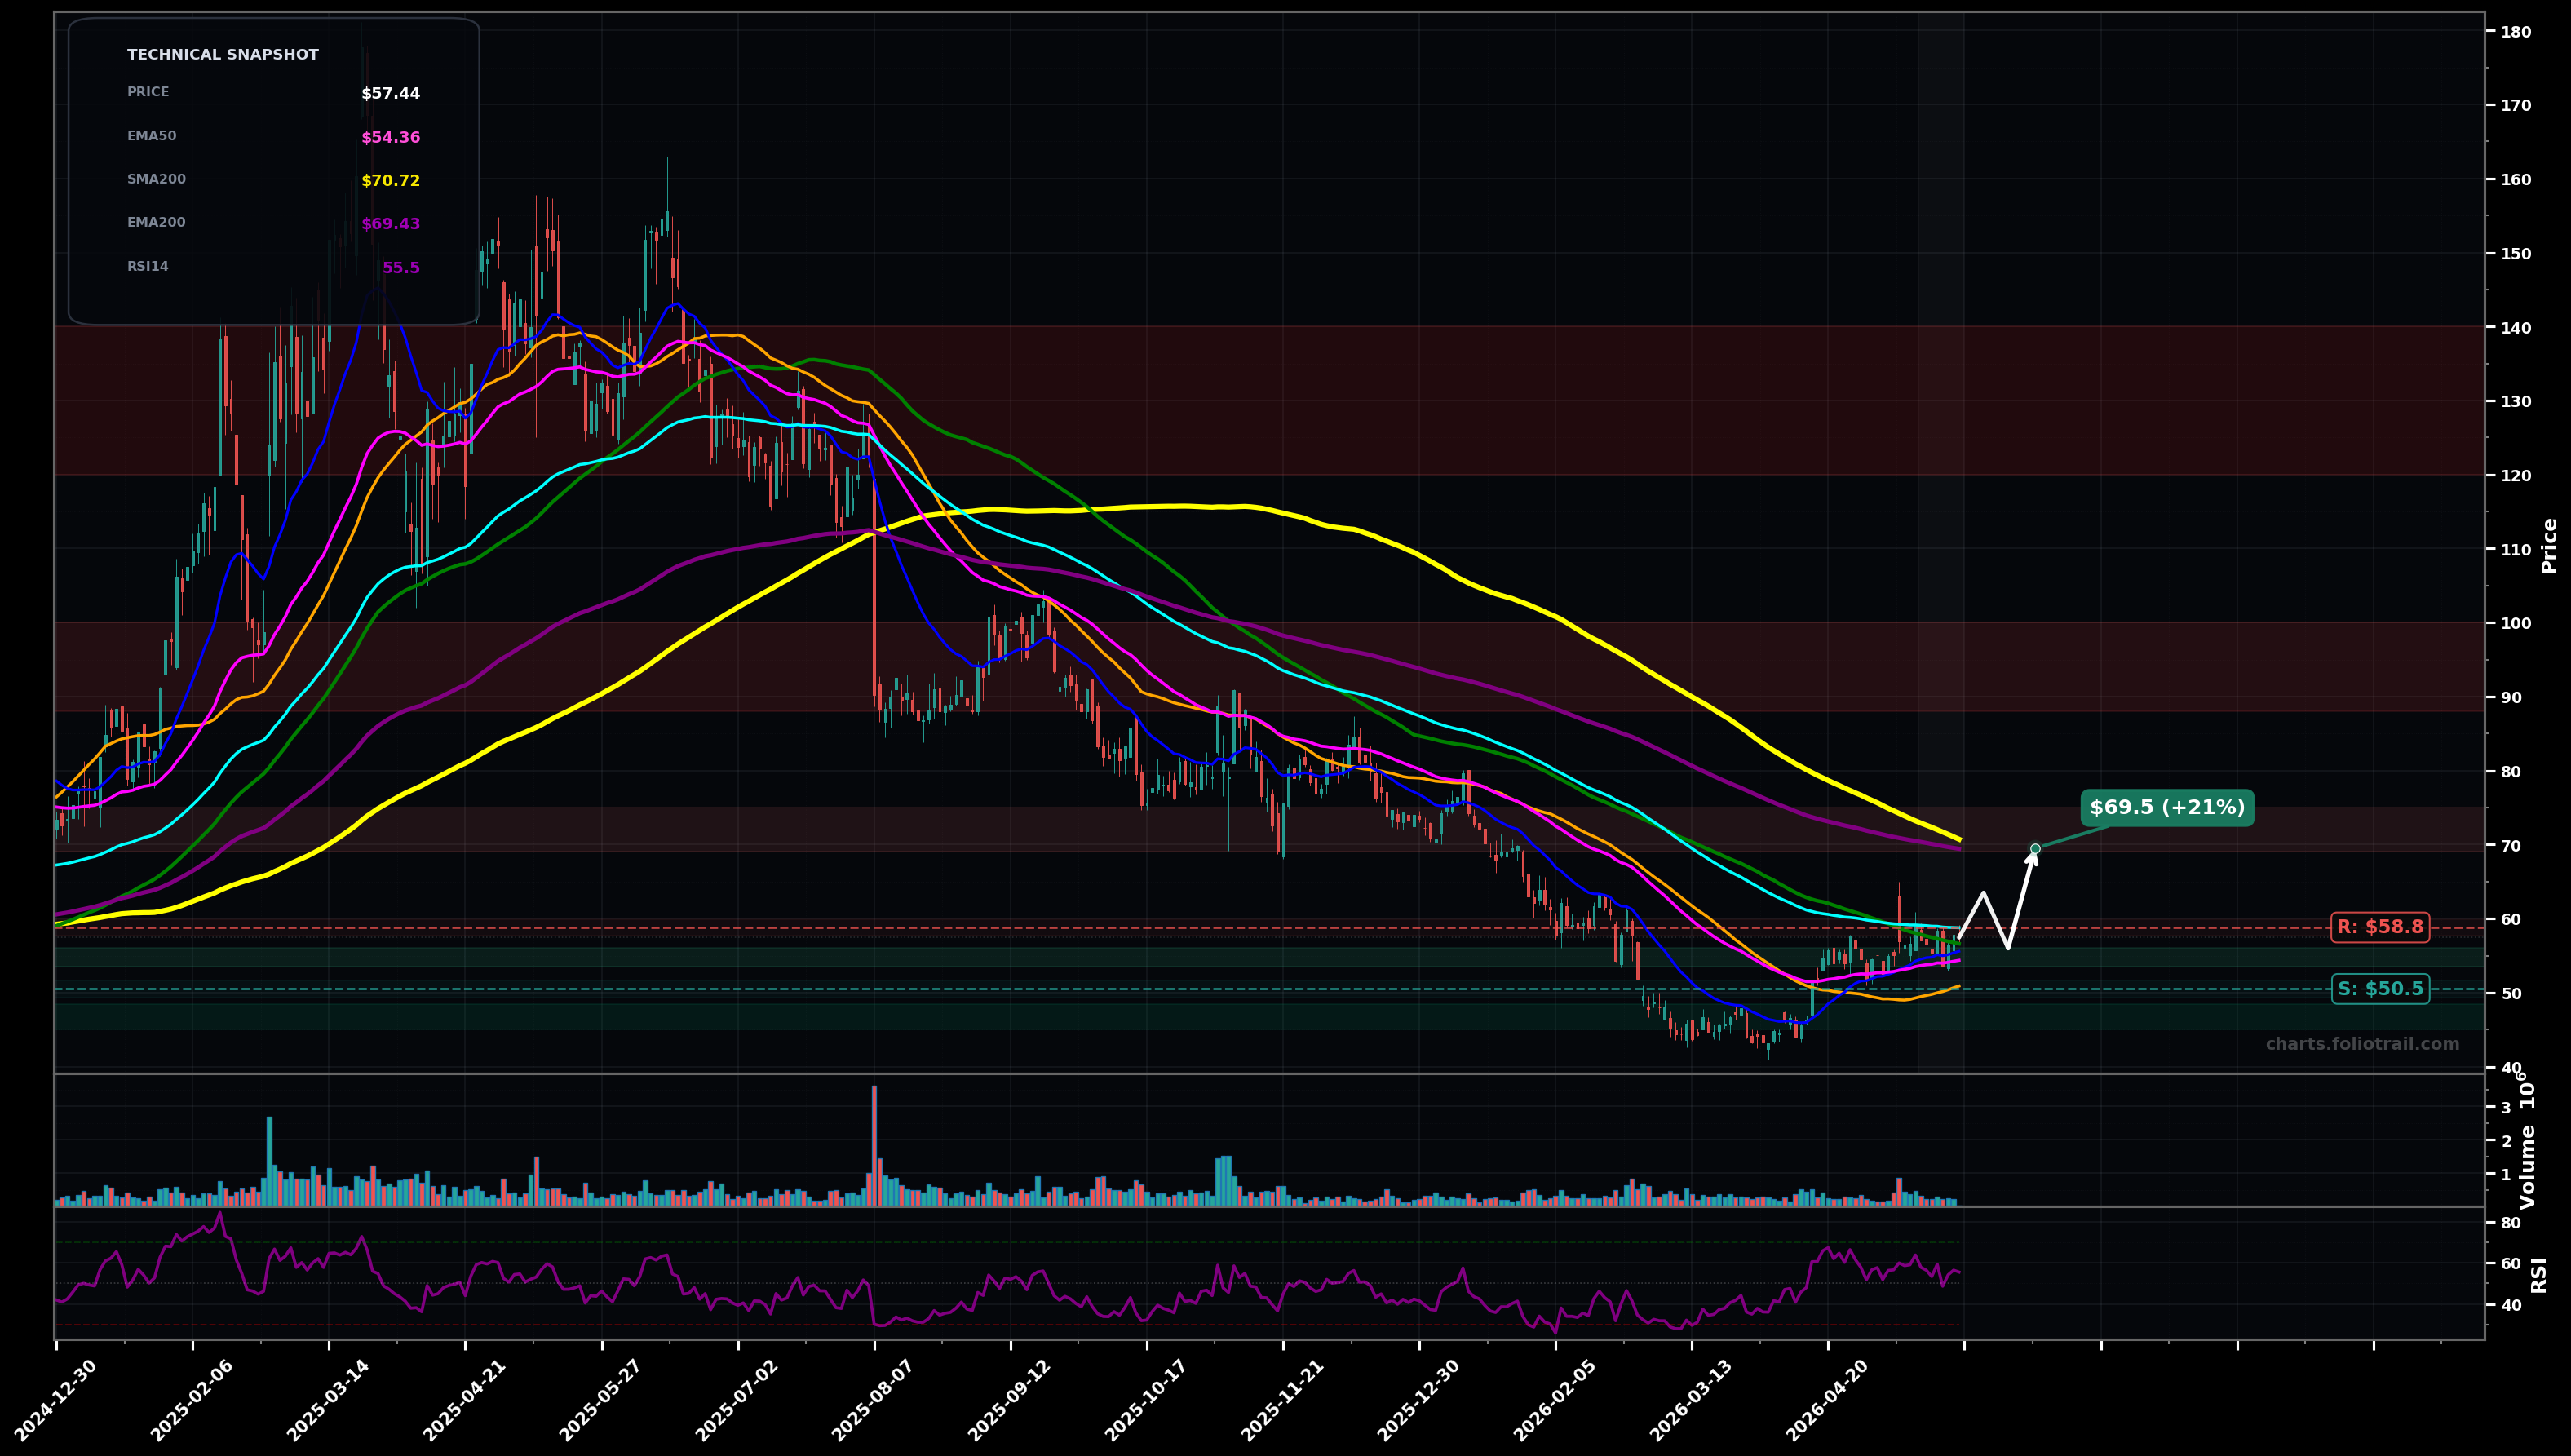
As of May 22, 2026, ROOT (Root, Inc. Class A Common Stock) is in a bottoming attempt state on the daily chart, with a confidence level of 62%. Key support is at $50.5 and key resistance at $58.8. Price at $57.44 is trying to base above rising short MAs (SMA50/EMA50) but remains capped below EMA100/SMA100 cluster; recent swing shows a higher low vs the March low.
Base continues: price consolidates between $54-$59 then breaks above the EMA100/SMA100 cluster, starting a larger mean-reversion leg toward the next supply zone.
Failed reclaim: rejection at $58-$59 leads to roll-over back into the base, with risk of a full retest of the prior swing low if $50.5 breaks.
Daily close > $59.00 and hold for 2+ closes (reclaim EMA100/SMA100 zone)
Daily close < $50.50 (loss of SMA50 and base lows)
Start near EMA50/SMA50 support, add on pullbacks to $50.5 base floor, heavy add only on a controlled retest of the major swing-low demand ~$45-$48.
Trim into major overhead MAs/likely fib supply (first near EMA200 ~$69), larger trims into prior distribution zones, and full exit if price becomes multi-year stretched back toward old highs.
As of May 22, 2026, ROOT (Root, Inc. Class A Common Stock) is in a bottoming attempt state on the daily chart with 62% confidence. Price at $57.44 is trying to base above rising short MAs (SMA50/EMA50) but remains capped below EMA100/SMA100 cluster; recent swing shows a higher low vs the March low.
On the daily timeframe, ROOT has key support at $50.5 and key resistance at $58.8. The most likely scenario (bullish) targets $63.5 and $69.5, with a revert level at $56.0.
ROOT (Root, Inc. Class A Common Stock) is currently classified as bottoming attempt on the daily chart, with 62% confidence. Confirmation requires: Daily close > $59.00 and hold for 2+ closes (reclaim EMA100/SMA100 zone) This would be invalidated by: Daily close < $50.50 (loss of SMA50 and base lows)
The most likely scenario (bullish) targets $63.5 and $69.5, with a revert level at $56.0. The alternative scenario (bearish) targets $52.0 and $45.0.
Multi-layer AI agents analyse 200+ stocks across daily, weekly, and monthly timeframes — producing market state classifications, price scenarios with targets, and position entry/exit levels. Daily charts updated every trading day at 6 PM ET. Weekly charts refresh Fridays. Monthly charts refresh on the last trading day of each month. No paywall. No sign-up required.
Built by Foliotrail.
All content on this website — including charts, analysis, price targets, support/resistance levels, and position zones — is generated entirely by AI and provided for educational and informational purposes only.
This is not financial advice. NEXUSNOIR VENTURES SL (the operator of this website) is not a registered investment adviser or broker-dealer. You should not make investment decisions based solely on this information. Always do your own research and consult a qualified financial advisor.
By continuing, you acknowledge that you have read and agree to our full disclaimer & terms of use and privacy policy.