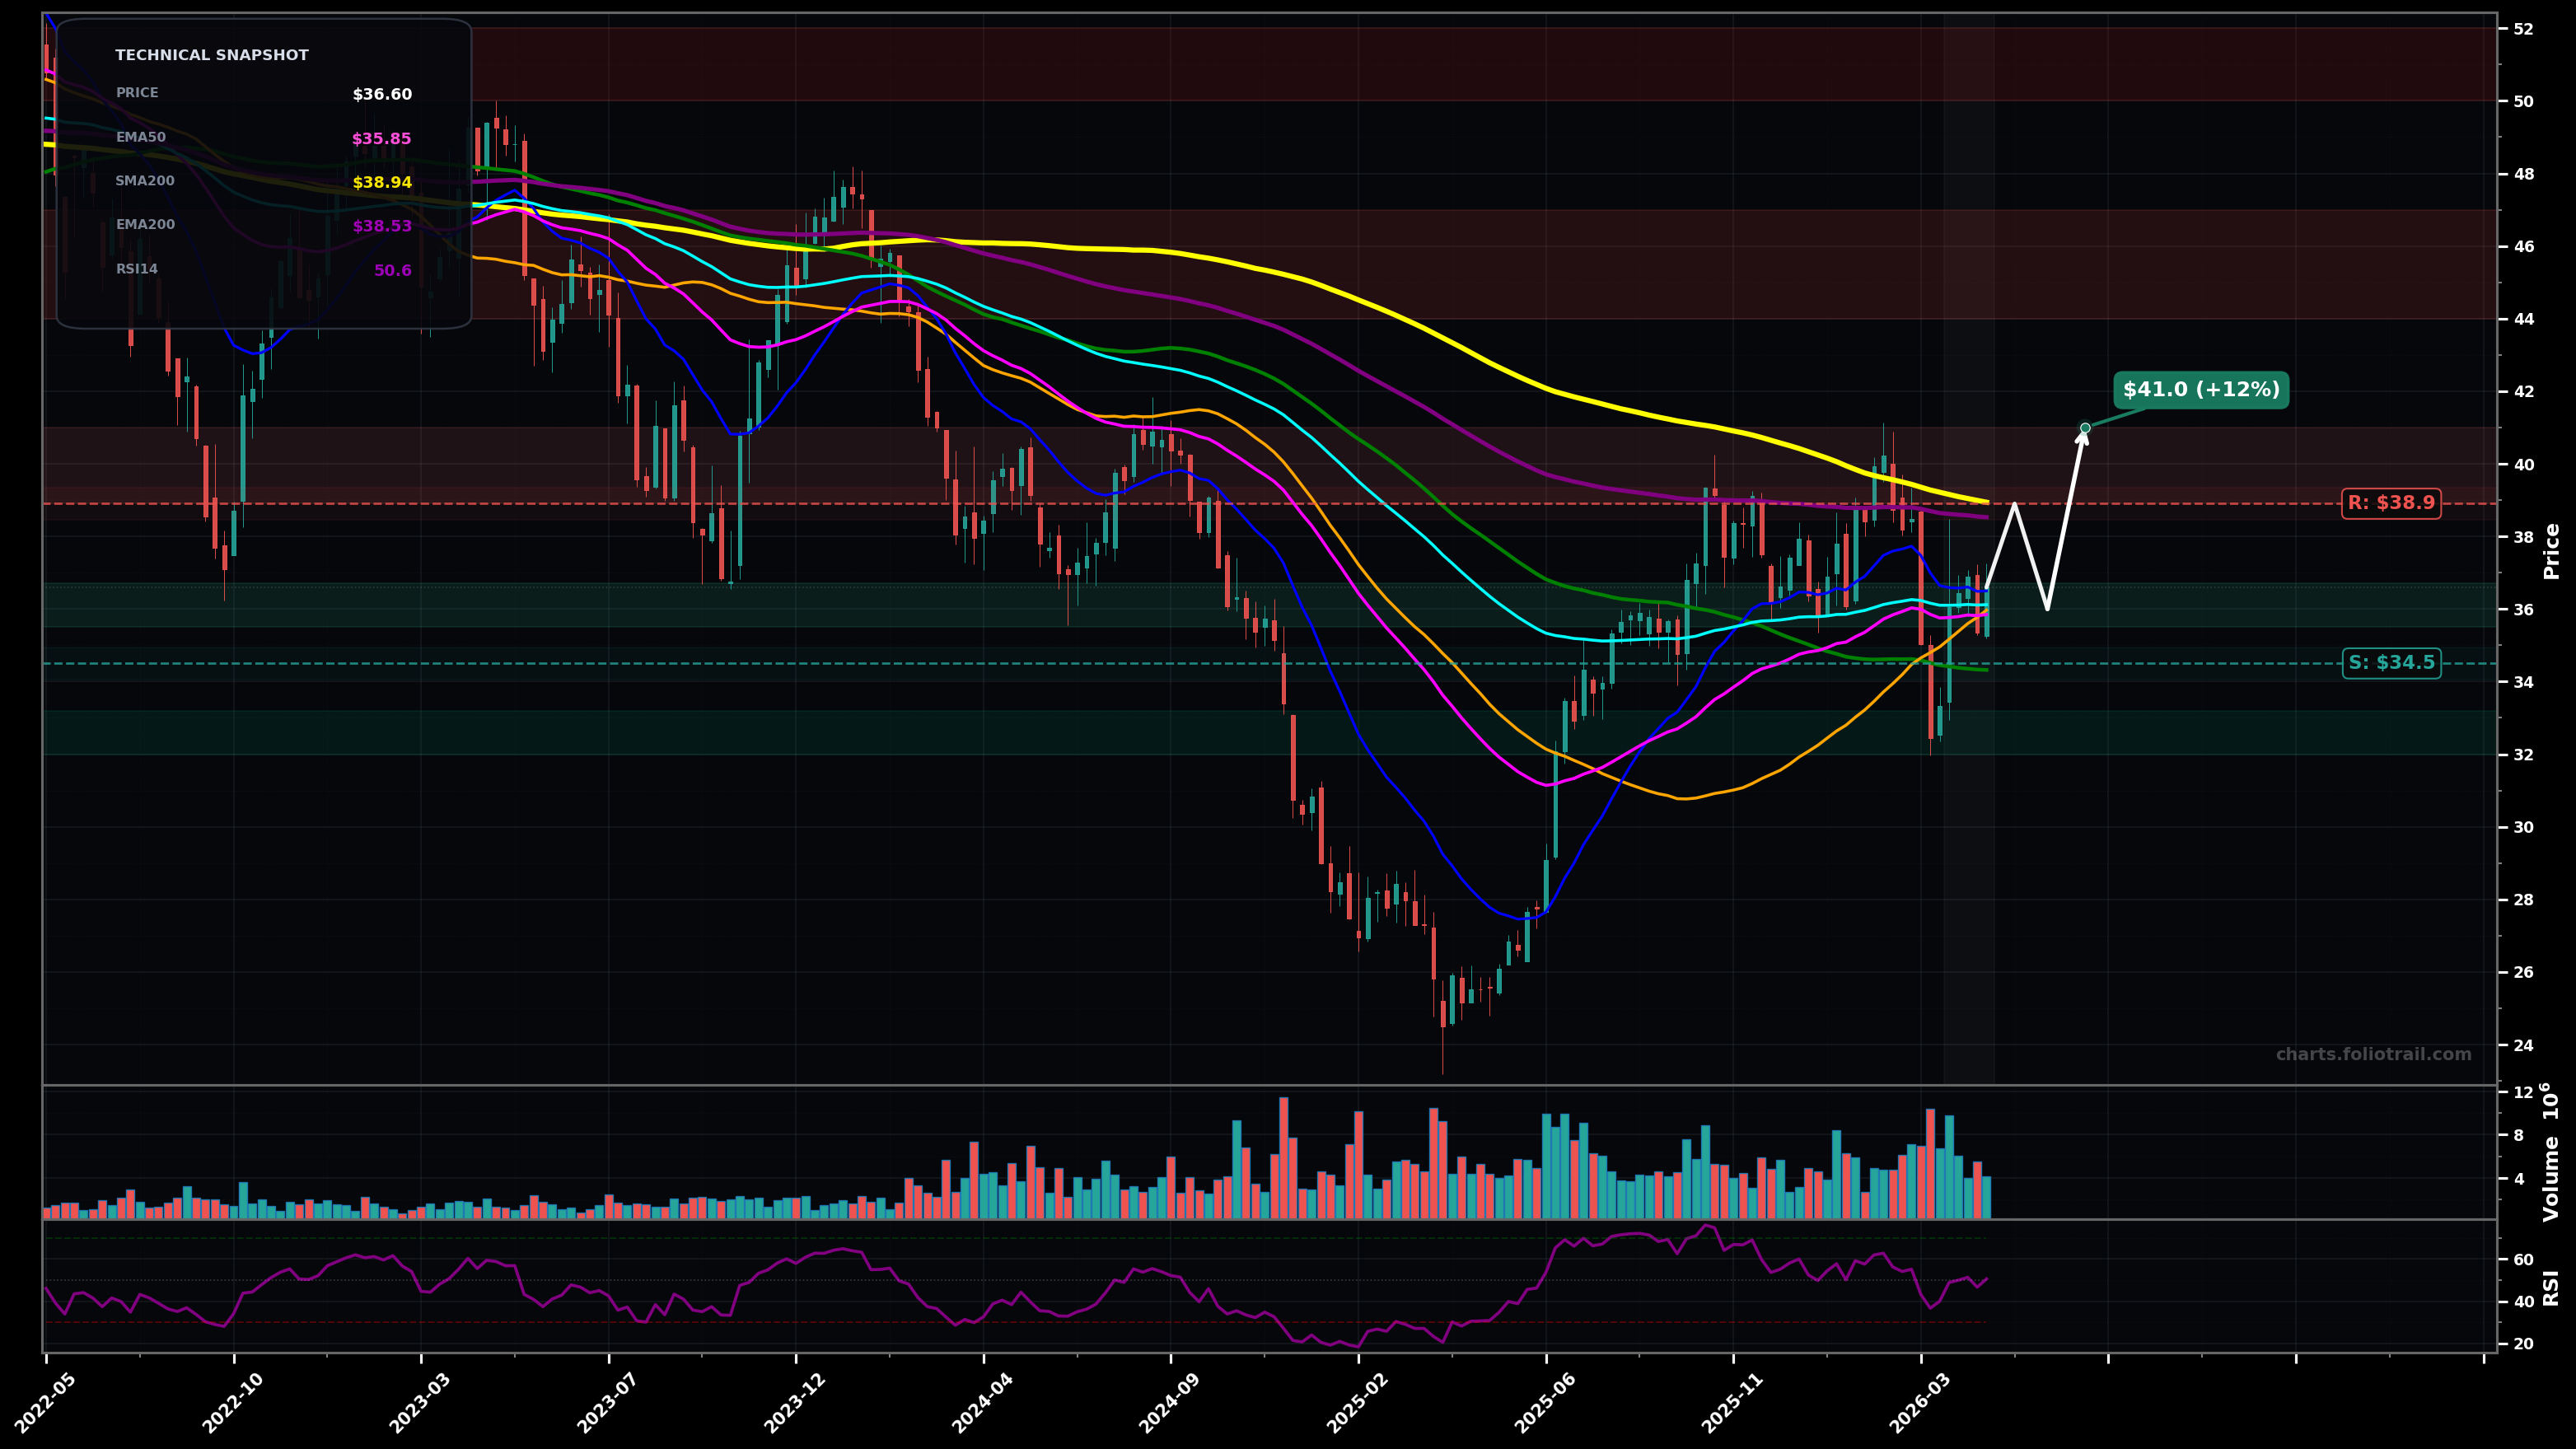
As of May 22, 2026, RCI (Rogers Communications Inc.) is in a choppy range state on the weekly chart, with a confidence level of 66%. Key support is at $34.5 and key resistance at $38.9. Weekly price near $36.60 is consolidating after a sharp selloff from ~$40-$41; candles are overlapping around EMA20/EMA50 with RSI ~50, while higher MAs (SMA200/EMA200) remain overhead.
Range continuation: oscillate between $34.50 support and $38.90 resistance; a push to retest the overhead cluster (SMA200/EMA200 zone) is likely but may reject on first touch.
Breakdown/retest: lose $34.50, then attempt a bounce that fails below reclaimed MAs; downside resumes toward the mid-$30s then high-$20s support area from the prior base/advance.
Confirm CHOPPY_RANGE if price holds between $34.50 and $38.90 for 2+ weekly closes
Invalidate if weekly close > $38.90 (breakout) or < $34.50 (breakdown)
Start near EMA20/EMA50 area with tight invalidation; add at range floor ($34.50); heavy add only if breakdown tags prior demand (~$32-33) while avoiding a prolonged LH/LL continuation.
Trim into first major MA/structure resistance ($38.9-$41); heavier trims into prior swing supply/Fib-extension zone ($44-$47); close if a full-cycle extension reaches ~$50+ (historical supply/round-number stretch).
As of May 22, 2026, RCI (Rogers Communications Inc.) is in a choppy range state on the weekly chart with 66% confidence. Weekly price near $36.60 is consolidating after a sharp selloff from ~$40-$41; candles are overlapping around EMA20/EMA50 with RSI ~50, while higher MAs (SMA200/EMA200) remain overhead.
On the weekly timeframe, RCI has key support at $34.5 and key resistance at $38.9. The most likely scenario (bullish) targets $38.9 and $41.0, with a revert level at $36.0.
RCI (Rogers Communications Inc.) is currently classified as choppy range on the weekly chart, with 66% confidence. Confirmation requires: Confirm CHOPPY_RANGE if price holds between $34.50 and $38.90 for 2+ weekly closes This would be invalidated by: Invalidate if weekly close > $38.90 (breakout) or < $34.50 (breakdown)
The most likely scenario (bullish) targets $38.9 and $41.0, with a revert level at $36.0. The alternative scenario (bearish) targets $32.0 and $28.0.
Multi-layer AI agents analyse 200+ stocks across daily, weekly, and monthly timeframes — producing market state classifications, price scenarios with targets, and position entry/exit levels. Daily charts updated every trading day at 6 PM ET. Weekly charts refresh Fridays. Monthly charts refresh on the last trading day of each month. No paywall. No sign-up required.
Built by Foliotrail.
All content on this website — including charts, analysis, price targets, support/resistance levels, and position zones — is generated entirely by AI and provided for educational and informational purposes only.
This is not financial advice. NEXUSNOIR VENTURES SL (the operator of this website) is not a registered investment adviser or broker-dealer. You should not make investment decisions based solely on this information. Always do your own research and consult a qualified financial advisor.
By continuing, you acknowledge that you have read and agree to our full disclaimer & terms of use and privacy policy.