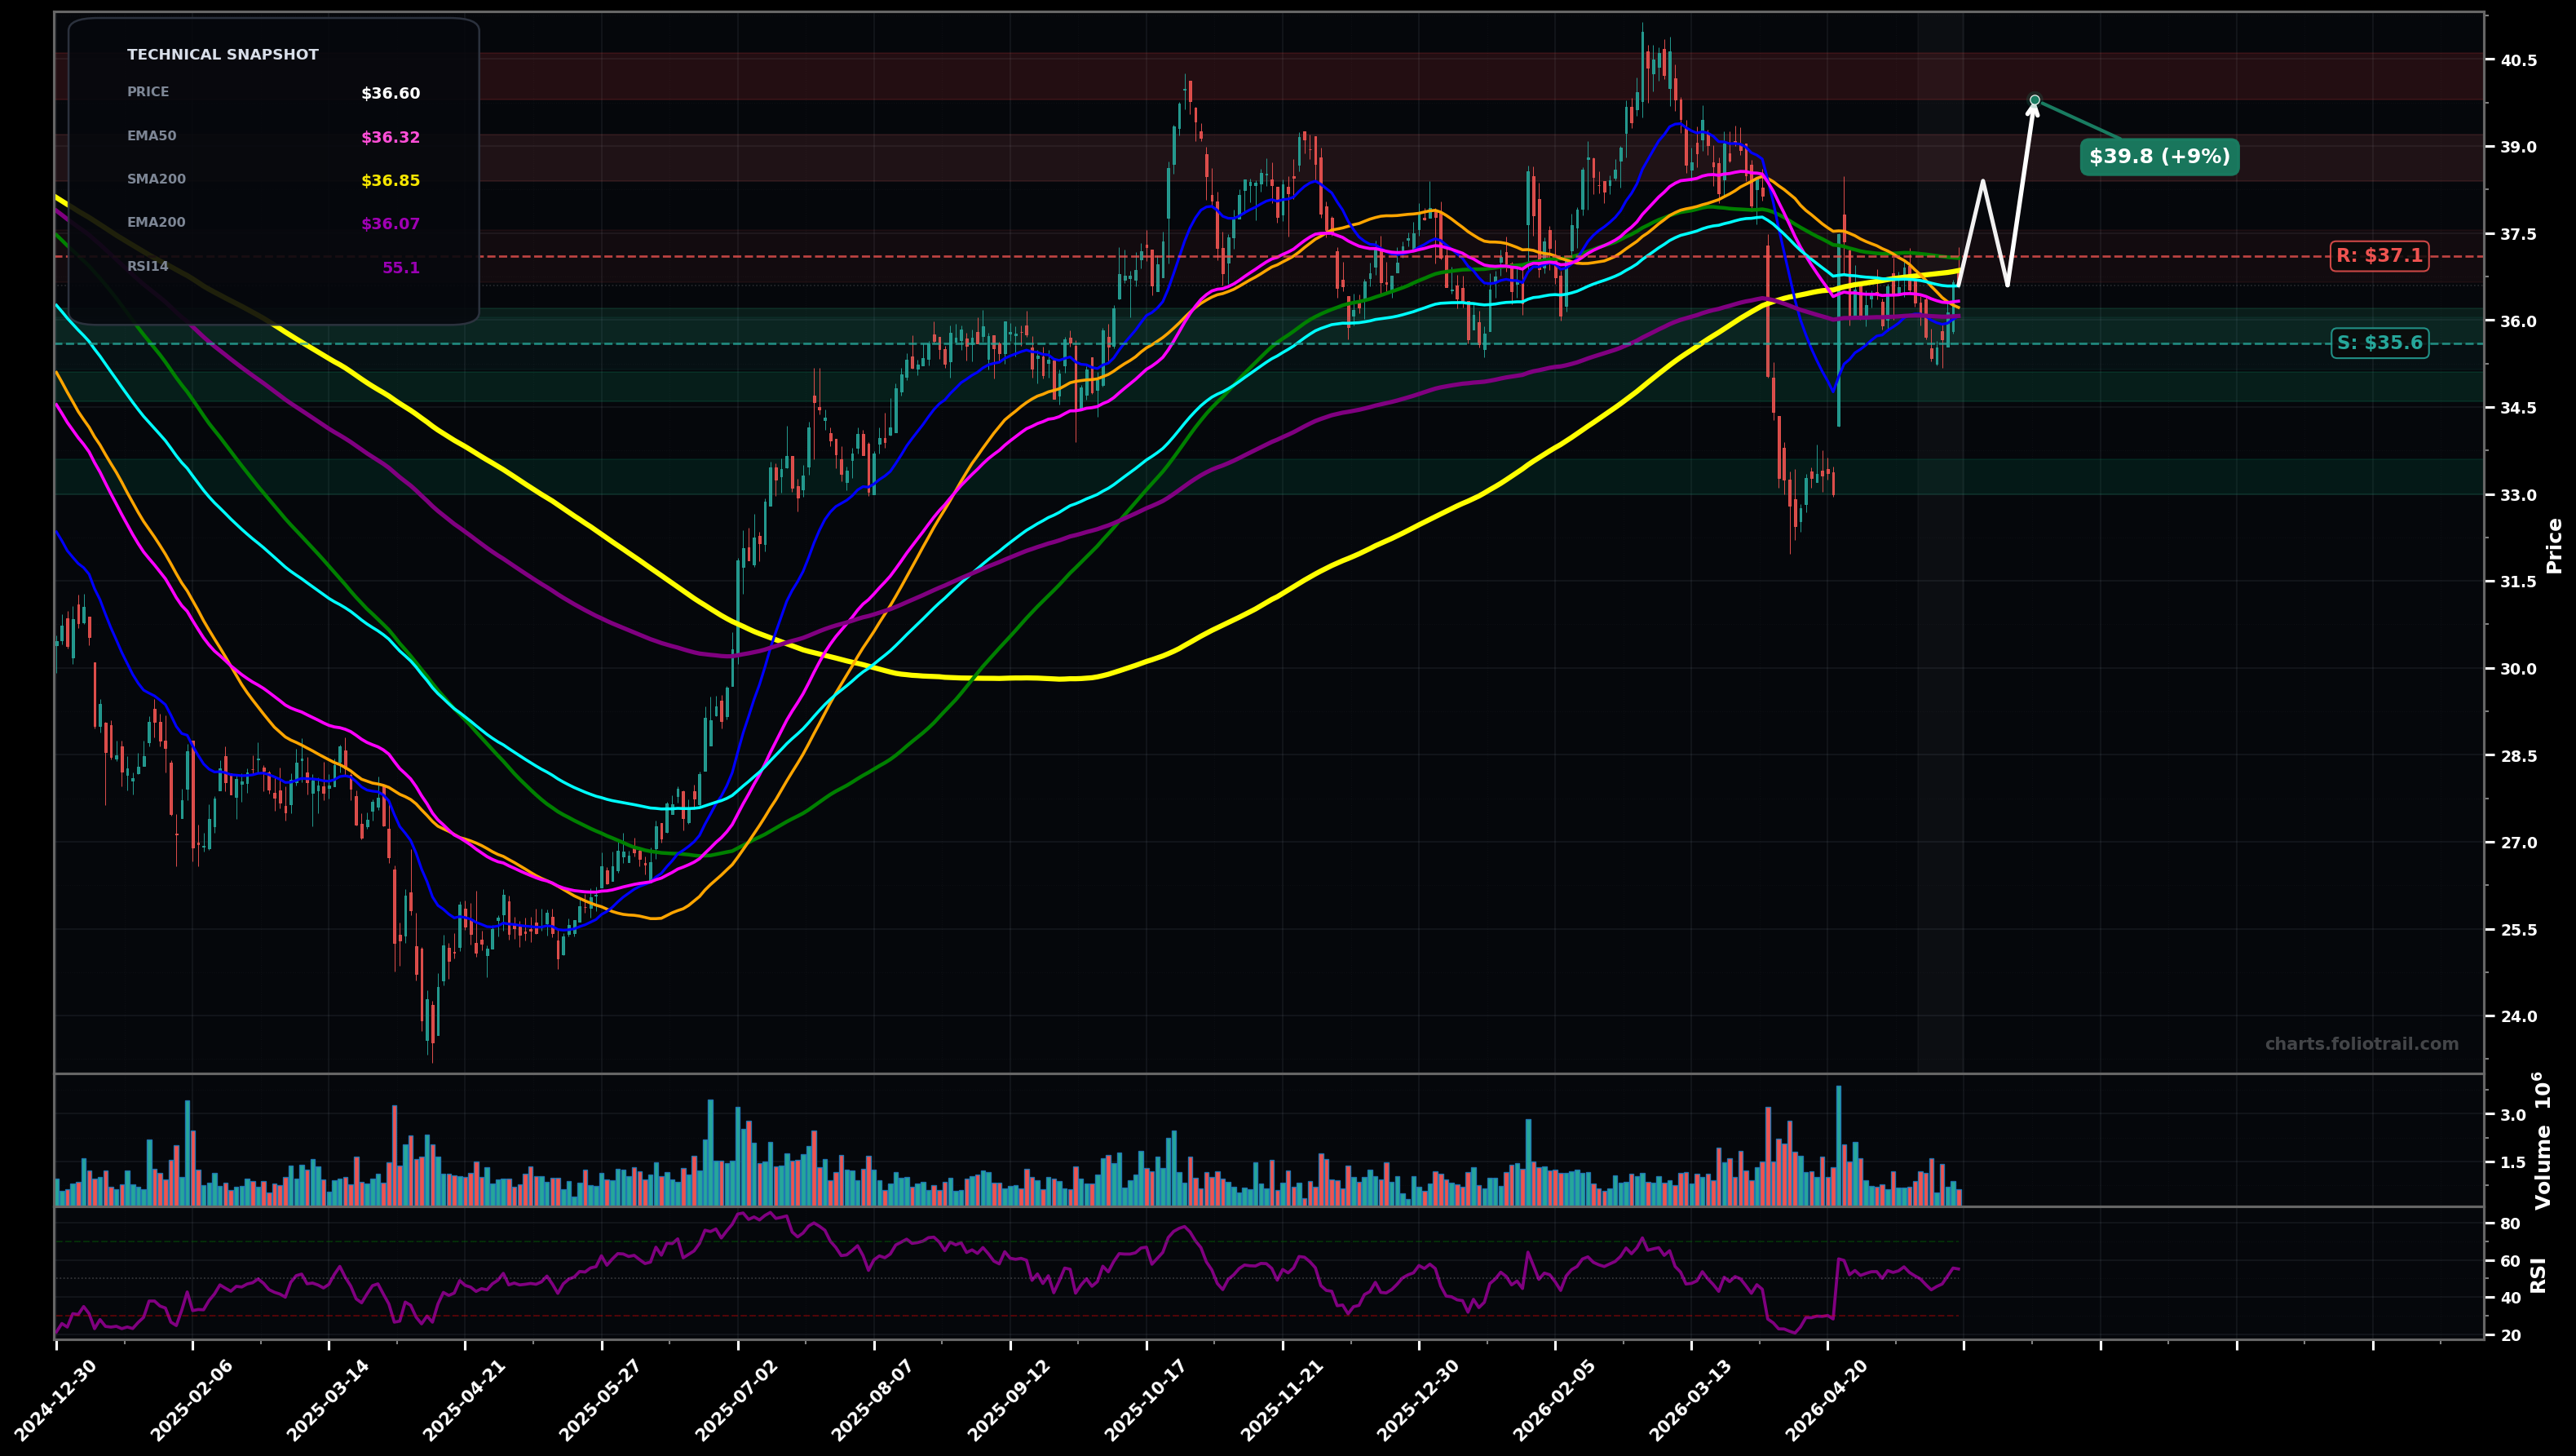
As of May 22, 2026, RCI (Rogers Communications Inc.) is in a choppy range state on the daily chart, with a confidence level of 64%. Key support is at $35.6 and key resistance at $37.1. Price is consolidating around clustered MAs (~$36–$37) after a sharp selloff from ~$40 and a rebound from the ~$33 area; RSI mid-50s suggests stabilization not strong trend.
Range resolves upward: hold $35.60 support, reclaim/hold above the $37.10 MA cluster, then grind toward the next supply from the breakdown area; fits an Elliott corrective structure where the post-crash base acts like wave (2)/(B) before a push up.
Range resolves downward: failure at $37.10 followed by a break of $35.60 reopens the post-flush downside, likely revisiting the swing-low zone; this would imply the bounce was a corrective wave (B)/(2) and price starts another impulsive leg down (wave (3)/(C) risk).
2+ daily closes above $37.10 with follow-through (holding above the MA cluster)
Daily close below $35.60 (lose the current base/MA shelf and prior swing support)
Buy zones are mapped to the current base shelf ($35.6), then prior demand/swing support ($34.6), then the flush-low region (~$33) where capitulation previously reversed.
Trim into overhead supply from the breakdown ($38.4–$40.6) and close if price becomes meaningfully extended above prior peak/upper resistance (>$41.5) relative to the current MA cluster.
As of May 22, 2026, RCI (Rogers Communications Inc.) is in a choppy range state on the daily chart with 64% confidence. Price is consolidating around clustered MAs (~$36–$37) after a sharp selloff from ~$40 and a rebound from the ~$33 area; RSI mid-50s suggests stabilization not strong trend.
On the daily timeframe, RCI has key support at $35.6 and key resistance at $37.1. The most likely scenario (bullish) targets $38.4 and $39.8, with a revert level at $36.6.
RCI (Rogers Communications Inc.) is currently classified as choppy range on the daily chart, with 64% confidence. Confirmation requires: 2+ daily closes above $37.10 with follow-through (holding above the MA cluster) This would be invalidated by: Daily close below $35.60 (lose the current base/MA shelf and prior swing support)
The most likely scenario (bullish) targets $38.4 and $39.8, with a revert level at $36.6. The alternative scenario (bearish) targets $34.6 and $33.0.
Multi-layer AI agents analyse 200+ stocks across daily, weekly, and monthly timeframes — producing market state classifications, price scenarios with targets, and position entry/exit levels. Daily charts updated every trading day at 6 PM ET. Weekly charts refresh Fridays. Monthly charts refresh on the last trading day of each month. No paywall. No sign-up required.
Built by Foliotrail.
All content on this website — including charts, analysis, price targets, support/resistance levels, and position zones — is generated entirely by AI and provided for educational and informational purposes only.
This is not financial advice. NEXUSNOIR VENTURES SL (the operator of this website) is not a registered investment adviser or broker-dealer. You should not make investment decisions based solely on this information. Always do your own research and consult a qualified financial advisor.
By continuing, you acknowledge that you have read and agree to our full disclaimer & terms of use and privacy policy.