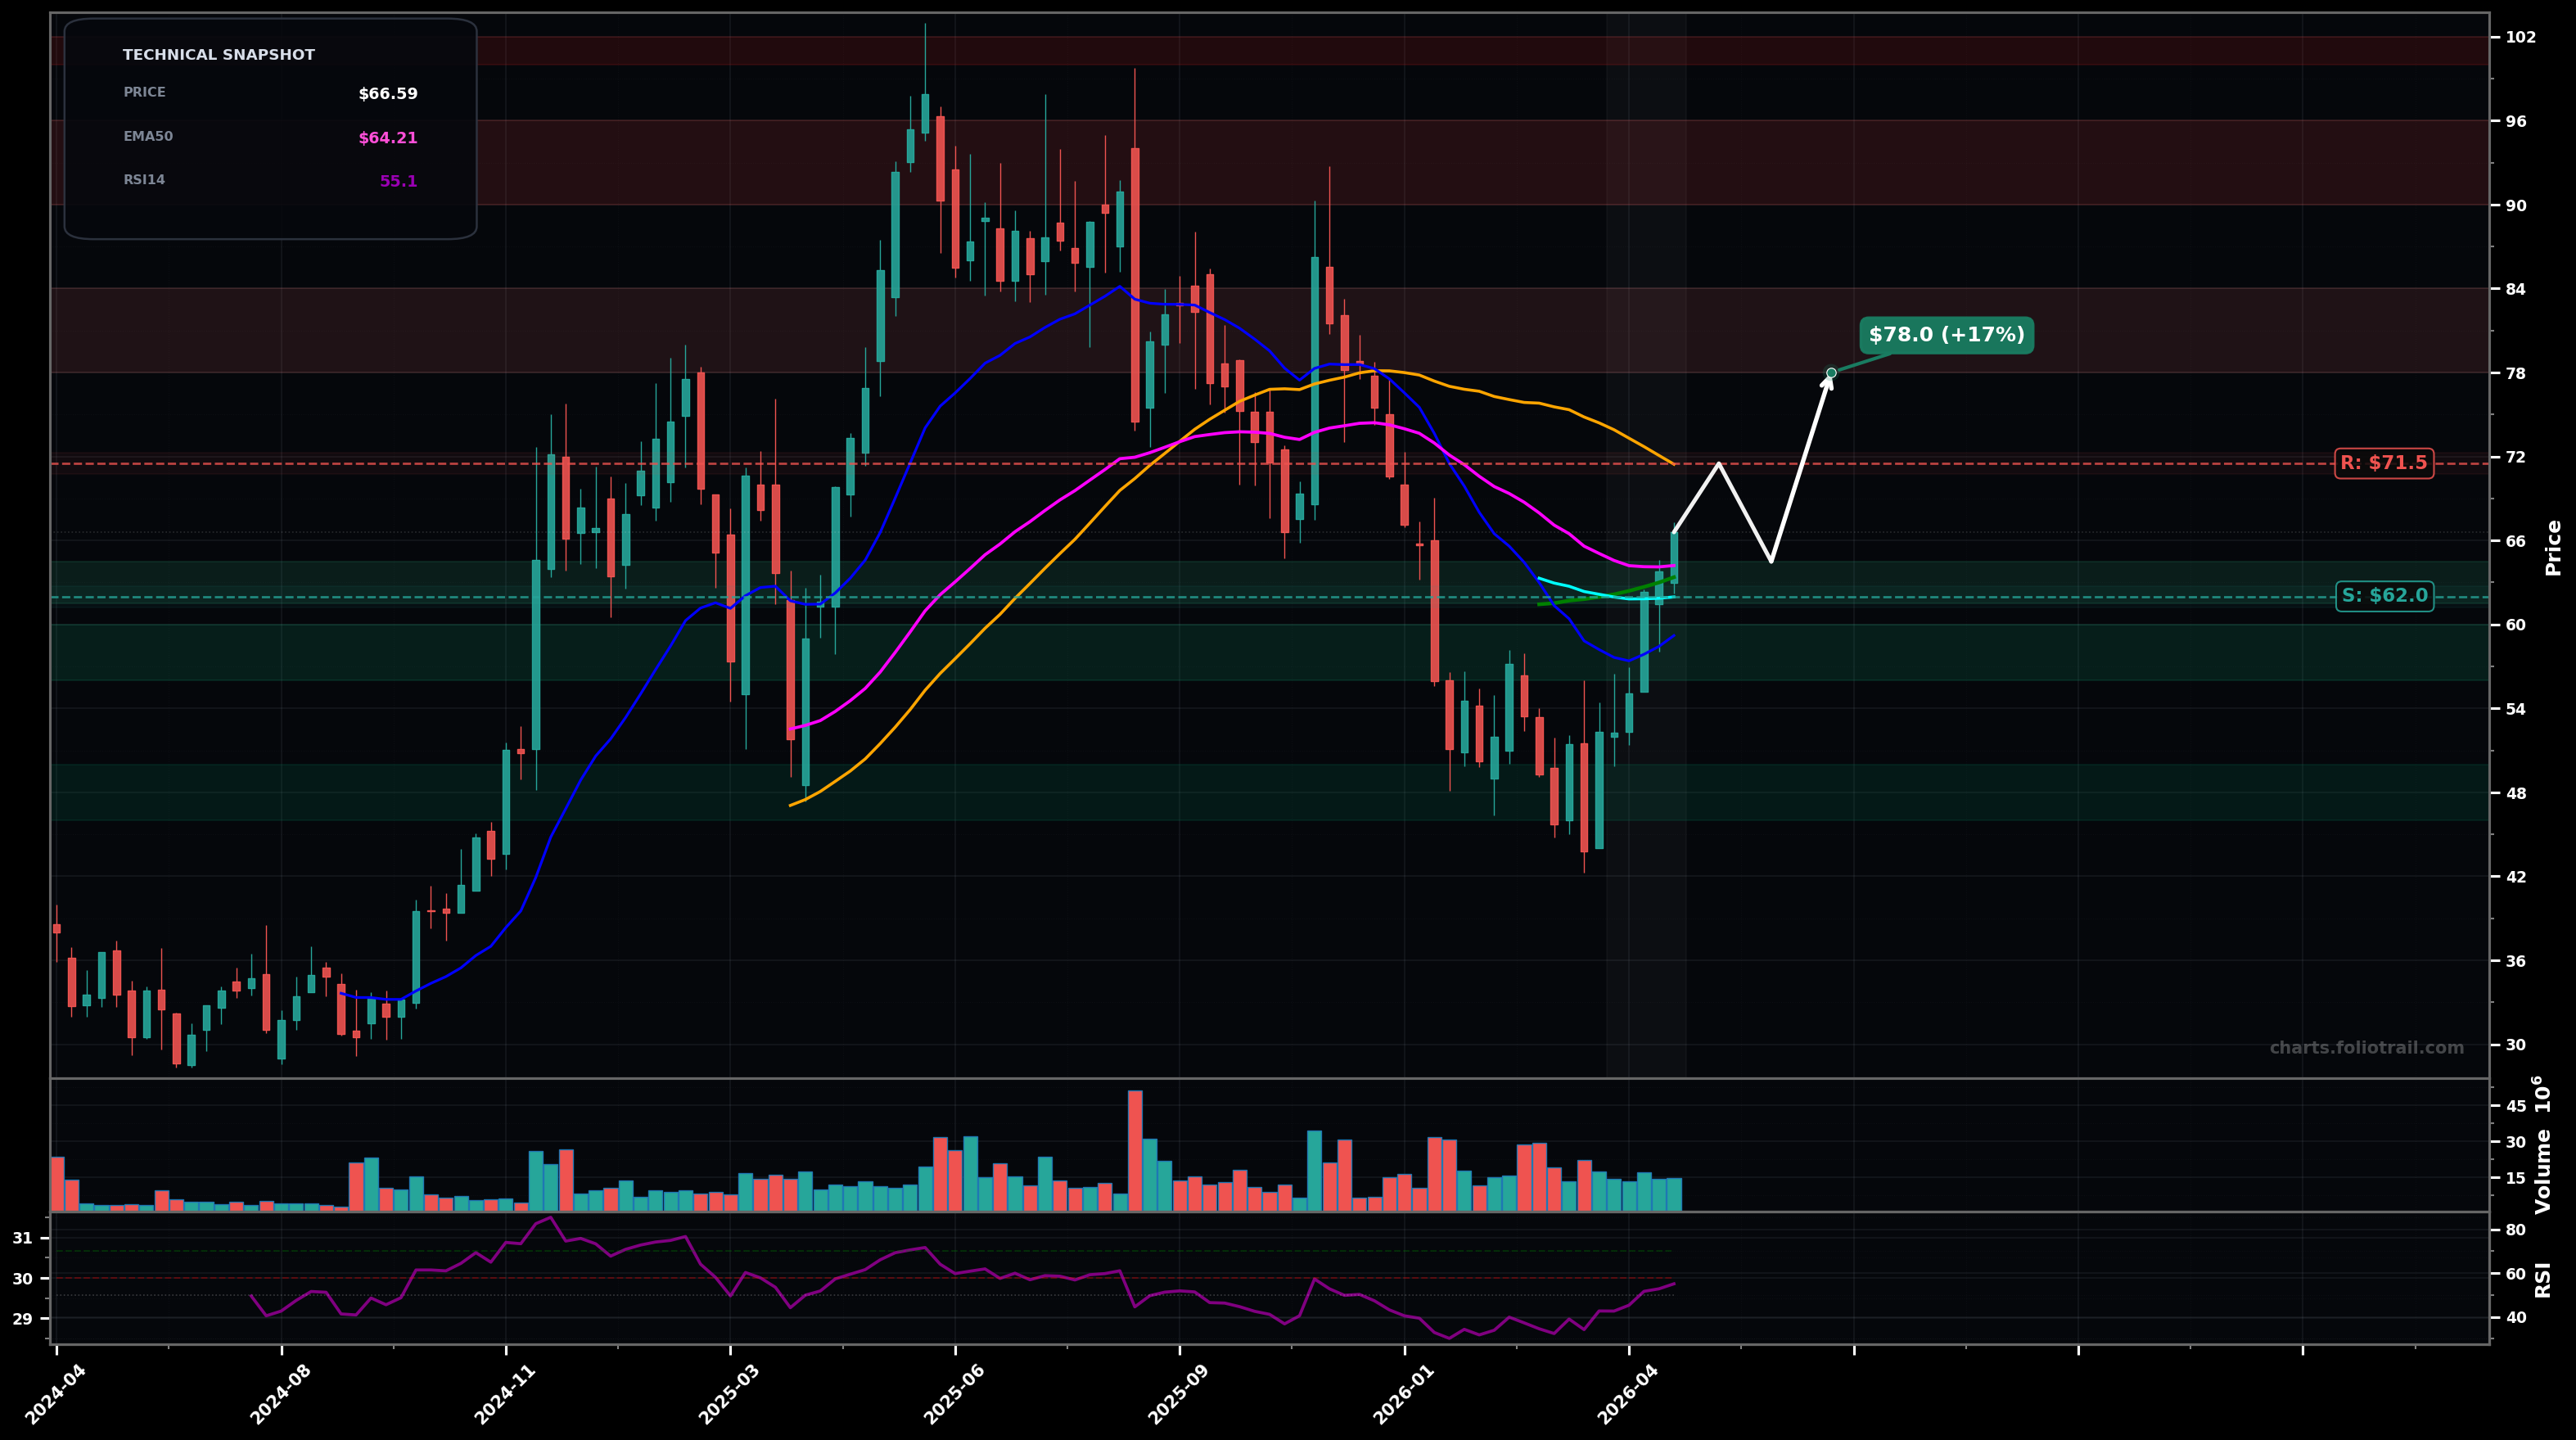
As of May 22, 2026, RBRK (Rubrik, Inc.) is in a bottoming attempt state on the weekly chart, with a confidence level of 63%. Key support is at $62.0 and key resistance at $71.5. Weekly rebound from the $46-$50 swing low, now trading $66.59 and pressing into the $66-$72 overhead MA cluster (SMA50/EMA50) after a multi-month selloff.
Base-to-reversal attempt: price consolidates above $62-$64, then breaks $71.5 and mean-reverts toward the prior breakdown zone; Elliott view: likely Wave (2) recovery within a larger bearish cycle (or start of a new 5-wave if $72+ holds).
Failed reclaim: rejection at the $71-$72 MA cluster (SMA50/EMA50) sends price back to retest the reclaimed EMA100/SMA100 area; if that fails, downside reopens toward the prior swing low.
2+ weekly closes above $72.00 (reclaim SMA50 area) with follow-through
Weekly close below $61.90 (loss of EMA100) that leads to a retest of $50s
Start near EMA100/SMA100 reclaim support; add on pullback toward prior demand mid-$50s; heavy add only on a full retest of the swing-low demand zone ($46-$50).
Trim into Fibonacci-style retrace/overhead supply zones from the prior decline (mid-$70s then $90s); close into the prior peak/supply near $100+ where reversal risk historically increases.
As of May 22, 2026, RBRK (Rubrik, Inc.) is in a bottoming attempt state on the weekly chart with 63% confidence. Weekly rebound from the $46-$50 swing low, now trading $66.59 and pressing into the $66-$72 overhead MA cluster (SMA50/EMA50) after a multi-month selloff.
On the weekly timeframe, RBRK has key support at $62.0 and key resistance at $71.5. The most likely scenario (bullish) targets $71.5 and $78.0, with a revert level at $64.5.
RBRK (Rubrik, Inc.) is currently classified as bottoming attempt on the weekly chart, with 63% confidence. Confirmation requires: 2+ weekly closes above $72.00 (reclaim SMA50 area) with follow-through This would be invalidated by: Weekly close below $61.90 (loss of EMA100) that leads to a retest of $50s
The most likely scenario (bullish) targets $71.5 and $78.0, with a revert level at $64.5. The alternative scenario (bearish) targets $62.0 and $50.0.
Multi-layer AI agents analyse 200+ stocks across daily, weekly, and monthly timeframes — producing market state classifications, price scenarios with targets, and position entry/exit levels. Daily charts updated every trading day at 6 PM ET. Weekly charts refresh Fridays. Monthly charts refresh on the last trading day of each month. No paywall. No sign-up required.
Built by Foliotrail.
All content on this website — including charts, analysis, price targets, support/resistance levels, and position zones — is generated entirely by AI and provided for educational and informational purposes only.
This is not financial advice. NEXUSNOIR VENTURES SL (the operator of this website) is not a registered investment adviser or broker-dealer. You should not make investment decisions based solely on this information. Always do your own research and consult a qualified financial advisor.
By continuing, you acknowledge that you have read and agree to our full disclaimer & terms of use and privacy policy.