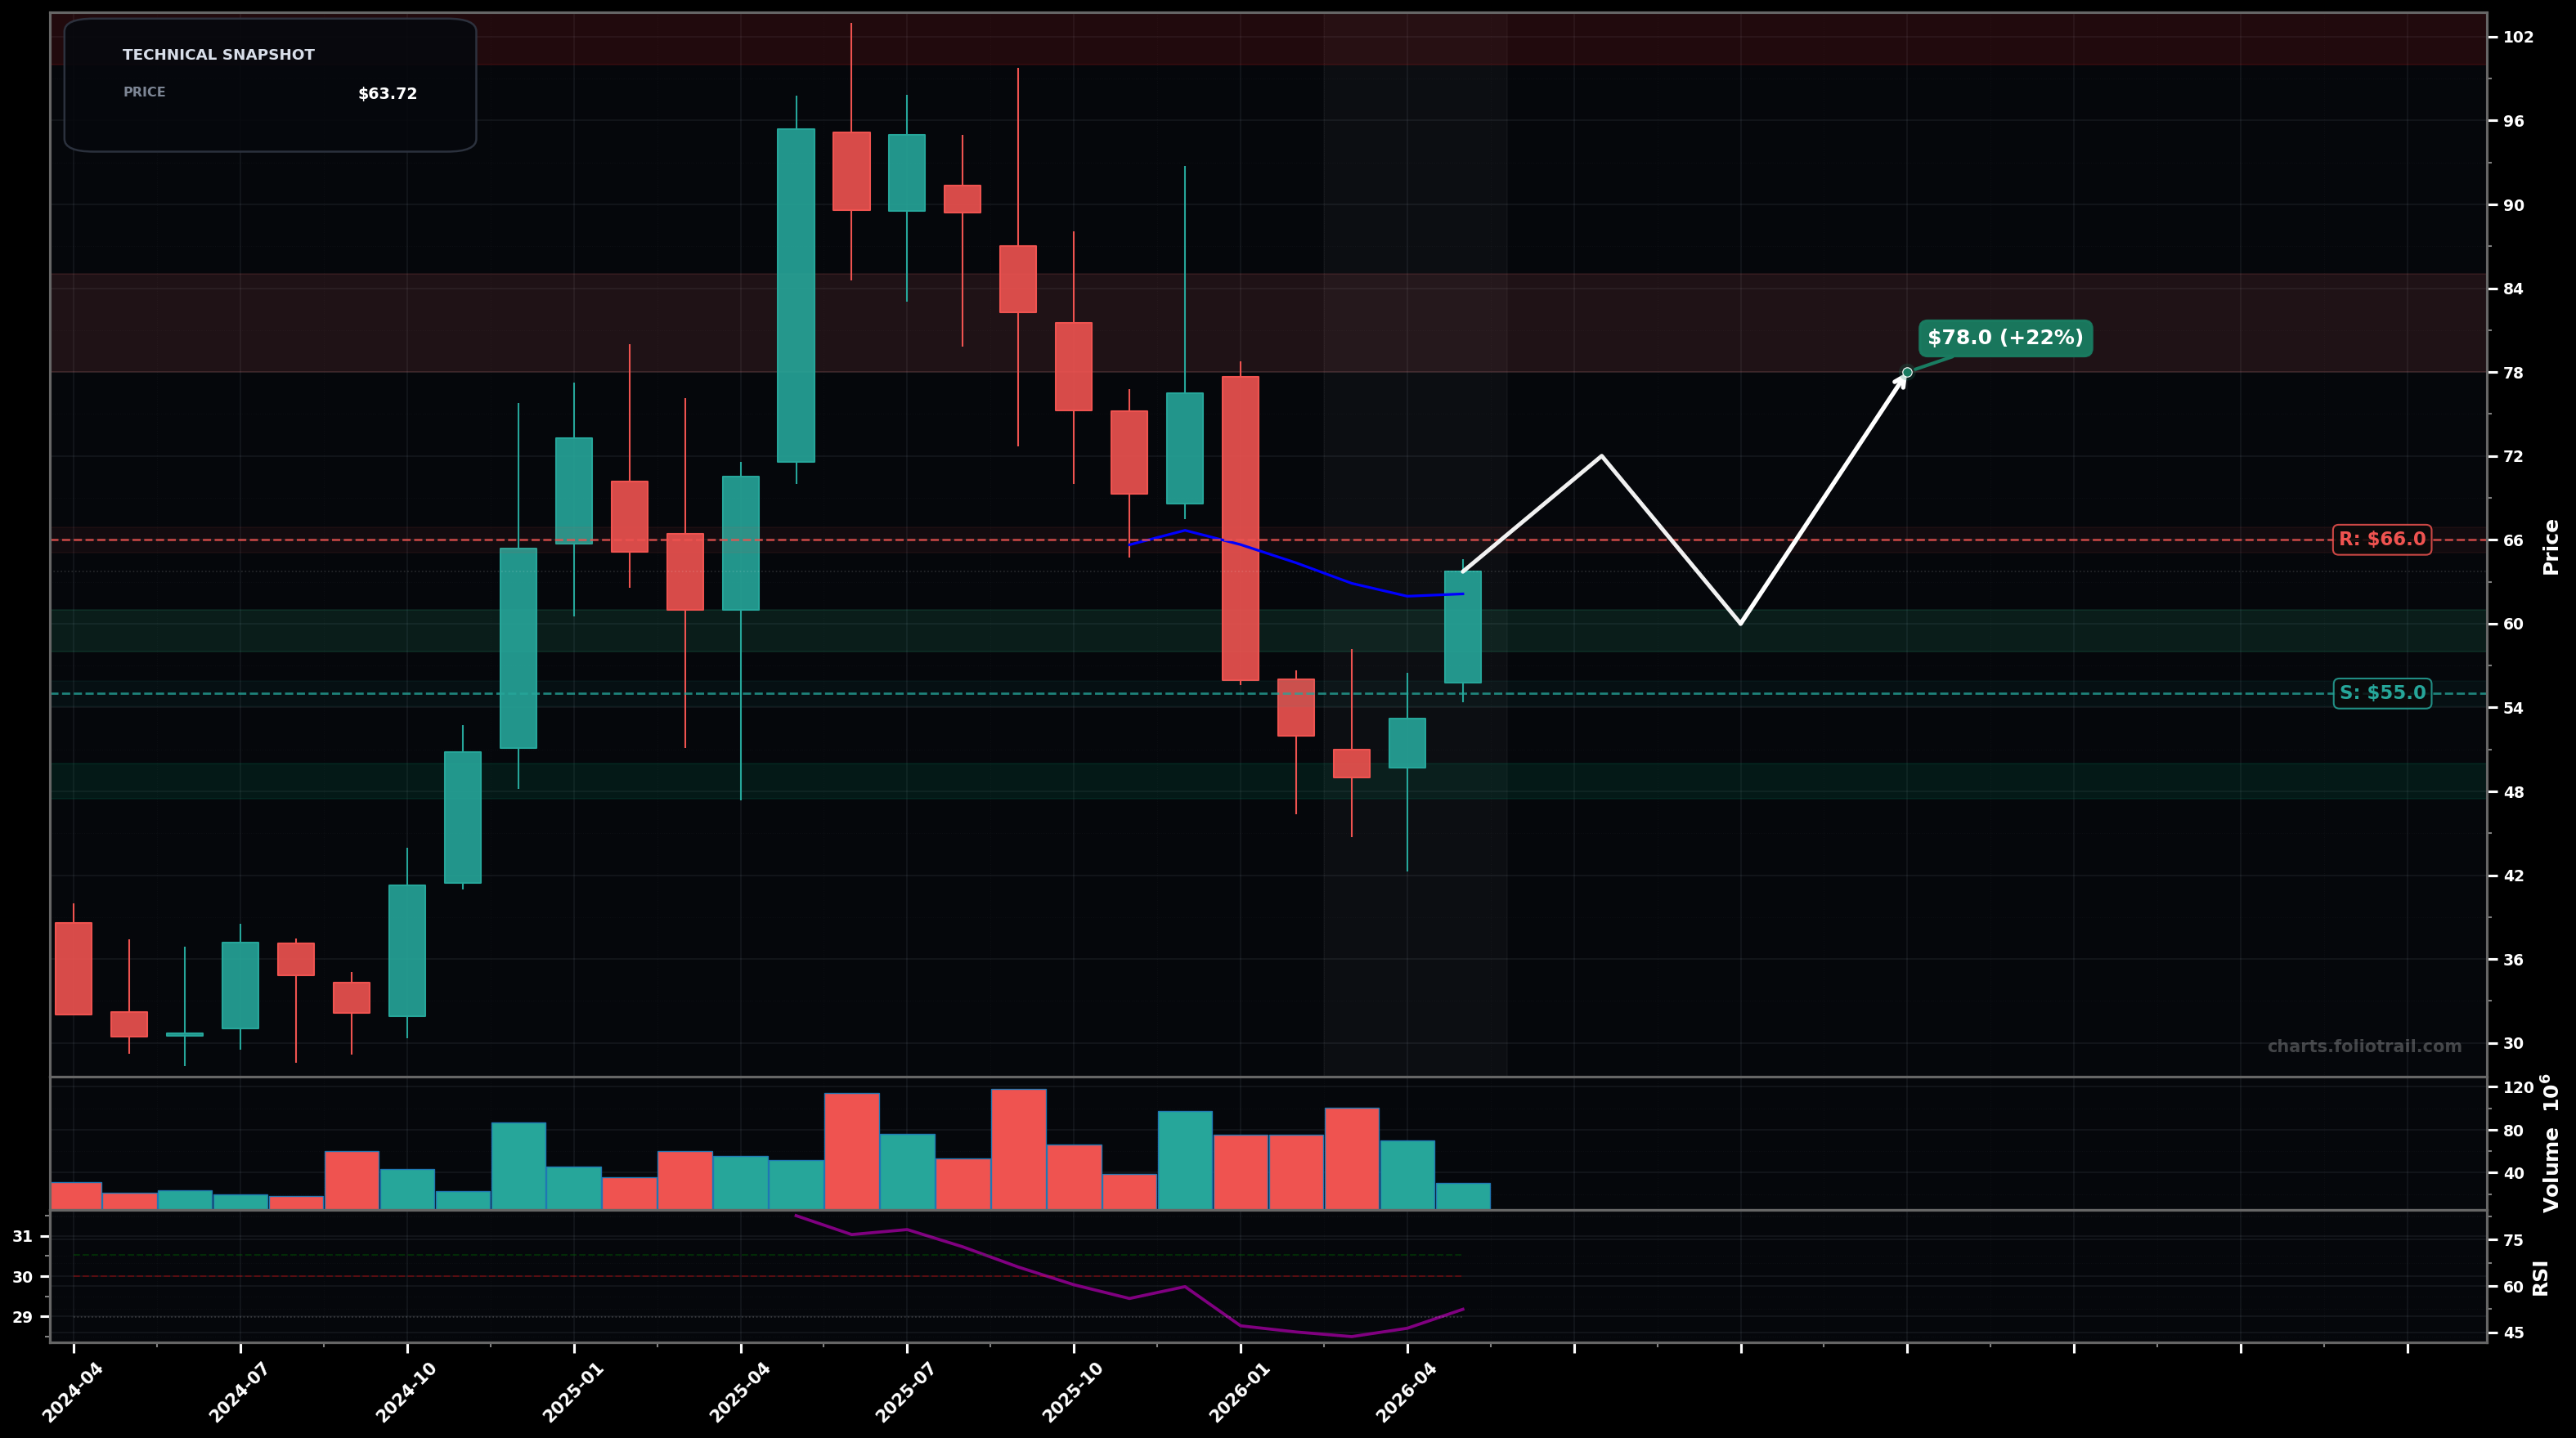
As of May 15, 2026, RBRK (Rubrik, Inc.) is in a bottoming attempt state on the monthly chart, with a confidence level of 62%. Key support is at $55.0 and key resistance at $66.0. Monthly bounce from the ~$48 swing low with 2 strong green candles; price reclaimed the short EMA (EMA20) and is probing prior breakdown area near mid-$60s; RSI back to ~52.
Base-build then push through $66; next leg targets the 0.382–0.50 Fibonacci retrace of the ~$96→$48 drop (mean-reversion toward prior supply). Rough probability ~60%.
Failure at $66 and rollover back into the range; retest the prior demand zone and possibly the swing low if risk-off resumes. Rough probability ~40%.
Monthly close above $66.00 (with follow-through next month holding >$66) confirms the bottoming attempt turning into a tradable reversal.
Monthly close below $48.00 invalidates the basing structure and reopens the downtrend.
Start on pullback toward reclaimed EMA20/near-term pivot; add at prior consolidation/support; heavy add only on deep retest/undercut of the swing-low zone with reversal behavior.
Trim into major Fibonacci retrace/overhead supply from the prior peak region; exit if price returns to clear multi-month excess above prior highs where mean-reversion risk is elevated.
As of May 15, 2026, RBRK (Rubrik, Inc.) is in a bottoming attempt state on the monthly chart with 62% confidence. Monthly bounce from the ~$48 swing low with 2 strong green candles; price reclaimed the short EMA (EMA20) and is probing prior breakdown area near mid-$60s; RSI back to ~52.
On the monthly timeframe, RBRK has key support at $55.0 and key resistance at $66.0. The most likely scenario (bullish) targets $72.0 and $78.0, with a revert level at $60.0.
RBRK (Rubrik, Inc.) is currently classified as bottoming attempt on the monthly chart, with 62% confidence. Confirmation requires: Monthly close above $66.00 (with follow-through next month holding >$66) confirms the bottoming attempt turning into a tradable reversal. This would be invalidated by: Monthly close below $48.00 invalidates the basing structure and reopens the downtrend.
The most likely scenario (bullish) targets $72.0 and $78.0, with a revert level at $60.0. The alternative scenario (bearish) targets $55.0 and $48.0.
Multi-layer AI agents analyse 200+ stocks across daily, weekly, and monthly timeframes — producing market state classifications, price scenarios with targets, and position entry/exit levels. Daily charts updated every trading day at 6 PM ET. Weekly charts refresh Fridays. Monthly charts refresh on the last trading day of each month. No paywall. No sign-up required.
Built by Foliotrail.
All content on this website — including charts, analysis, price targets, support/resistance levels, and position zones — is generated entirely by AI and provided for educational and informational purposes only.
This is not financial advice. NEXUSNOIR VENTURES SL (the operator of this website) is not a registered investment adviser or broker-dealer. You should not make investment decisions based solely on this information. Always do your own research and consult a qualified financial advisor.
By continuing, you acknowledge that you have read and agree to our full disclaimer & terms of use and privacy policy.