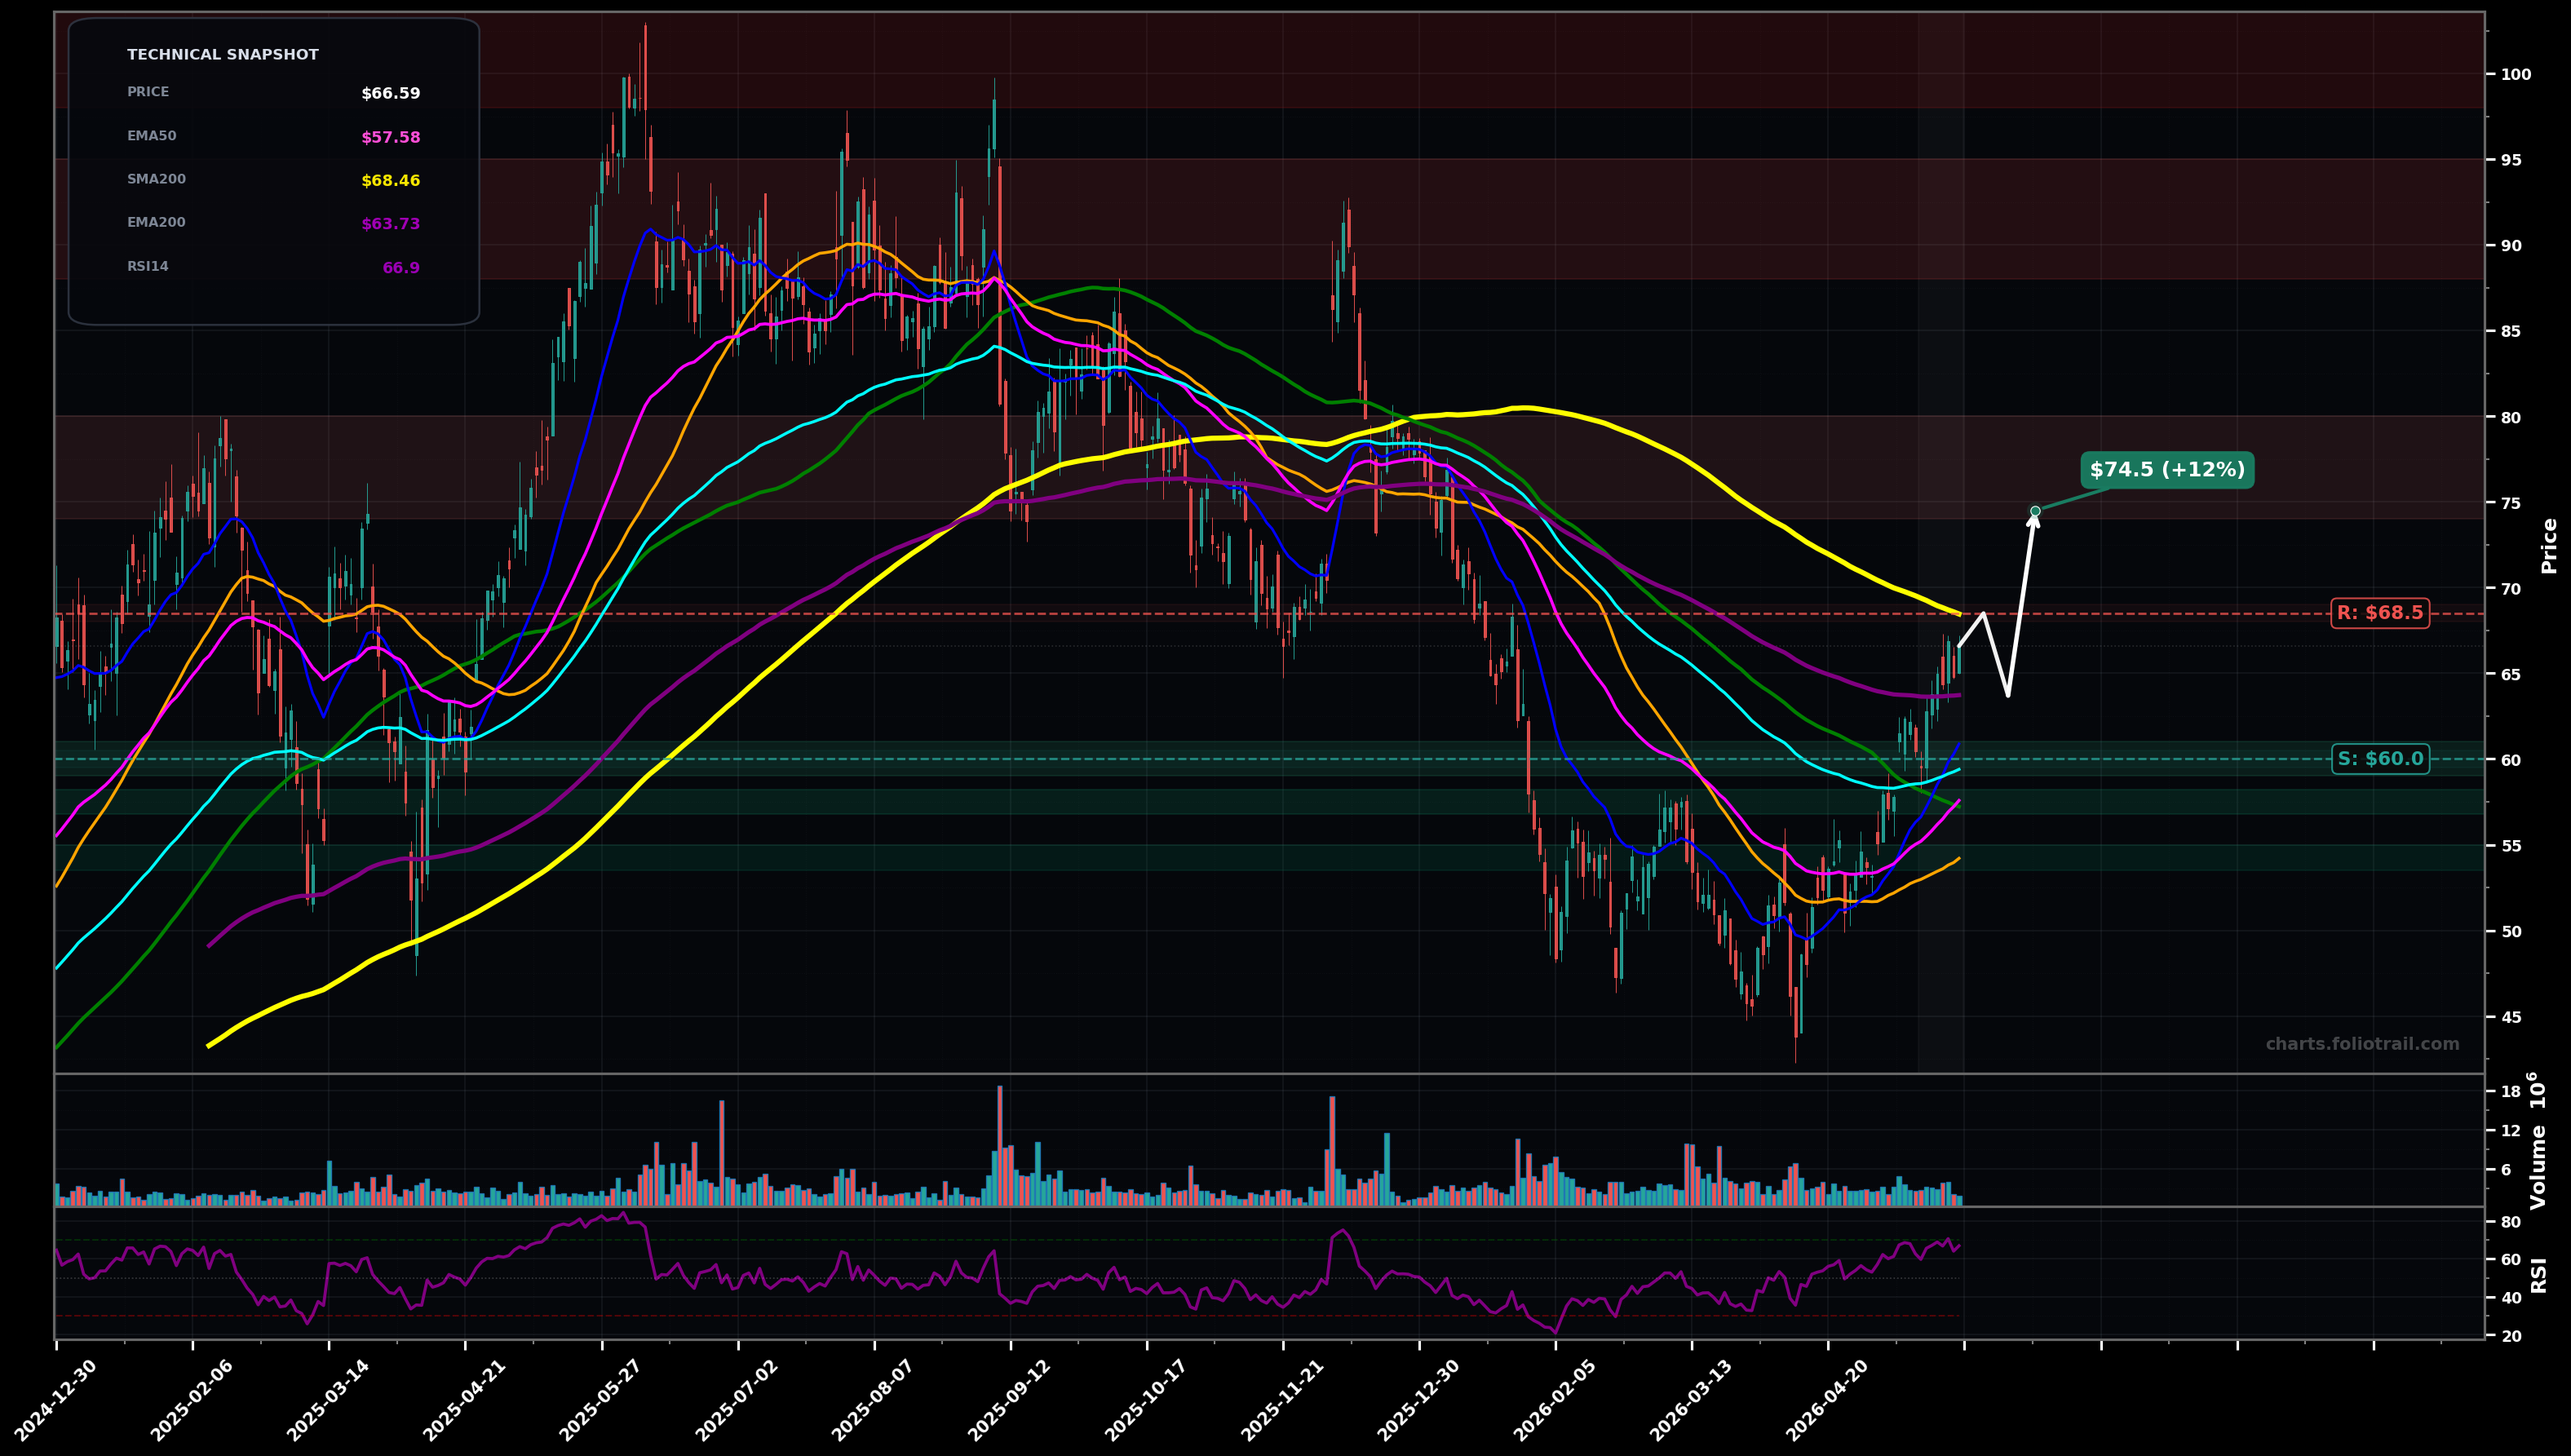
As of May 22, 2026, RBRK (Rubrik, Inc.) is in a breakout reversal state on the daily chart, with a confidence level of 62%. Key support is at $60.0 and key resistance at $68.5. Price is rebounding from the spring low area (~$45) and is now above SMA50 ($54.20), EMA50 ($57.58) and EMA100 ($59.40), but still below EMA200 ($63.73) and SMA200 ($68.46); momentum is strong (RSI ~66.9) into the $66-$68 supply zone.
Most likely: price pauses/consolidates under the SMA200/previous breakdown zone ($66-$69), then breaks through and retests it as support, continuing the rebound toward the next fib/structure resistance area.
Second likely: rejection at the $66-$69 supply (EMA200/SMA200 area) triggers a pullback to retest the reclaimed EMA100/EMA50 zone; if that fails, price rotates back toward the prior breakout base.
Daily close > $68.50 with a second close holding above $68.00
Daily close < $57.50
Buy-the-dip zones align with EMA100/EMA50 reclaim ($59-$61), then last-resort support at EMA50/structure ($57-$58), then SMA50 + prior base shelf (~$54-$55) if a deeper retest occurs.
Trim into overhead structure from the prior distribution band and fib extensions from the ~$45 swing low (first at ~$74-$80, then ~$88-$95), with full exit reserved for a return to the prior blow-off zone near the old highs (~$100+).
As of May 22, 2026, RBRK (Rubrik, Inc.) is in a breakout reversal state on the daily chart with 62% confidence. Price is rebounding from the spring low area (~$45) and is now above SMA50 ($54.20), EMA50 ($57.58) and EMA100 ($59.40), but still below EMA200 ($63.73) and SMA200 ($68.46); momentum is strong (RSI ~66.9) into the $66-$68 supply zone.
On the daily timeframe, RBRK has key support at $60.0 and key resistance at $68.5. The most likely scenario (bullish) targets $68.5 and $74.5, with a revert level at $63.7.
RBRK (Rubrik, Inc.) is currently classified as breakout reversal on the daily chart, with 62% confidence. Confirmation requires: Daily close > $68.50 with a second close holding above $68.00 This would be invalidated by: Daily close < $57.50
The most likely scenario (bullish) targets $68.5 and $74.5, with a revert level at $63.7. The alternative scenario (bearish) targets $59.5 and $54.2.
Multi-layer AI agents analyse 200+ stocks across daily, weekly, and monthly timeframes — producing market state classifications, price scenarios with targets, and position entry/exit levels. Daily charts updated every trading day at 6 PM ET. Weekly charts refresh Fridays. Monthly charts refresh on the last trading day of each month. No paywall. No sign-up required.
Built by Foliotrail.
All content on this website — including charts, analysis, price targets, support/resistance levels, and position zones — is generated entirely by AI and provided for educational and informational purposes only.
This is not financial advice. NEXUSNOIR VENTURES SL (the operator of this website) is not a registered investment adviser or broker-dealer. You should not make investment decisions based solely on this information. Always do your own research and consult a qualified financial advisor.
By continuing, you acknowledge that you have read and agree to our full disclaimer & terms of use and privacy policy.