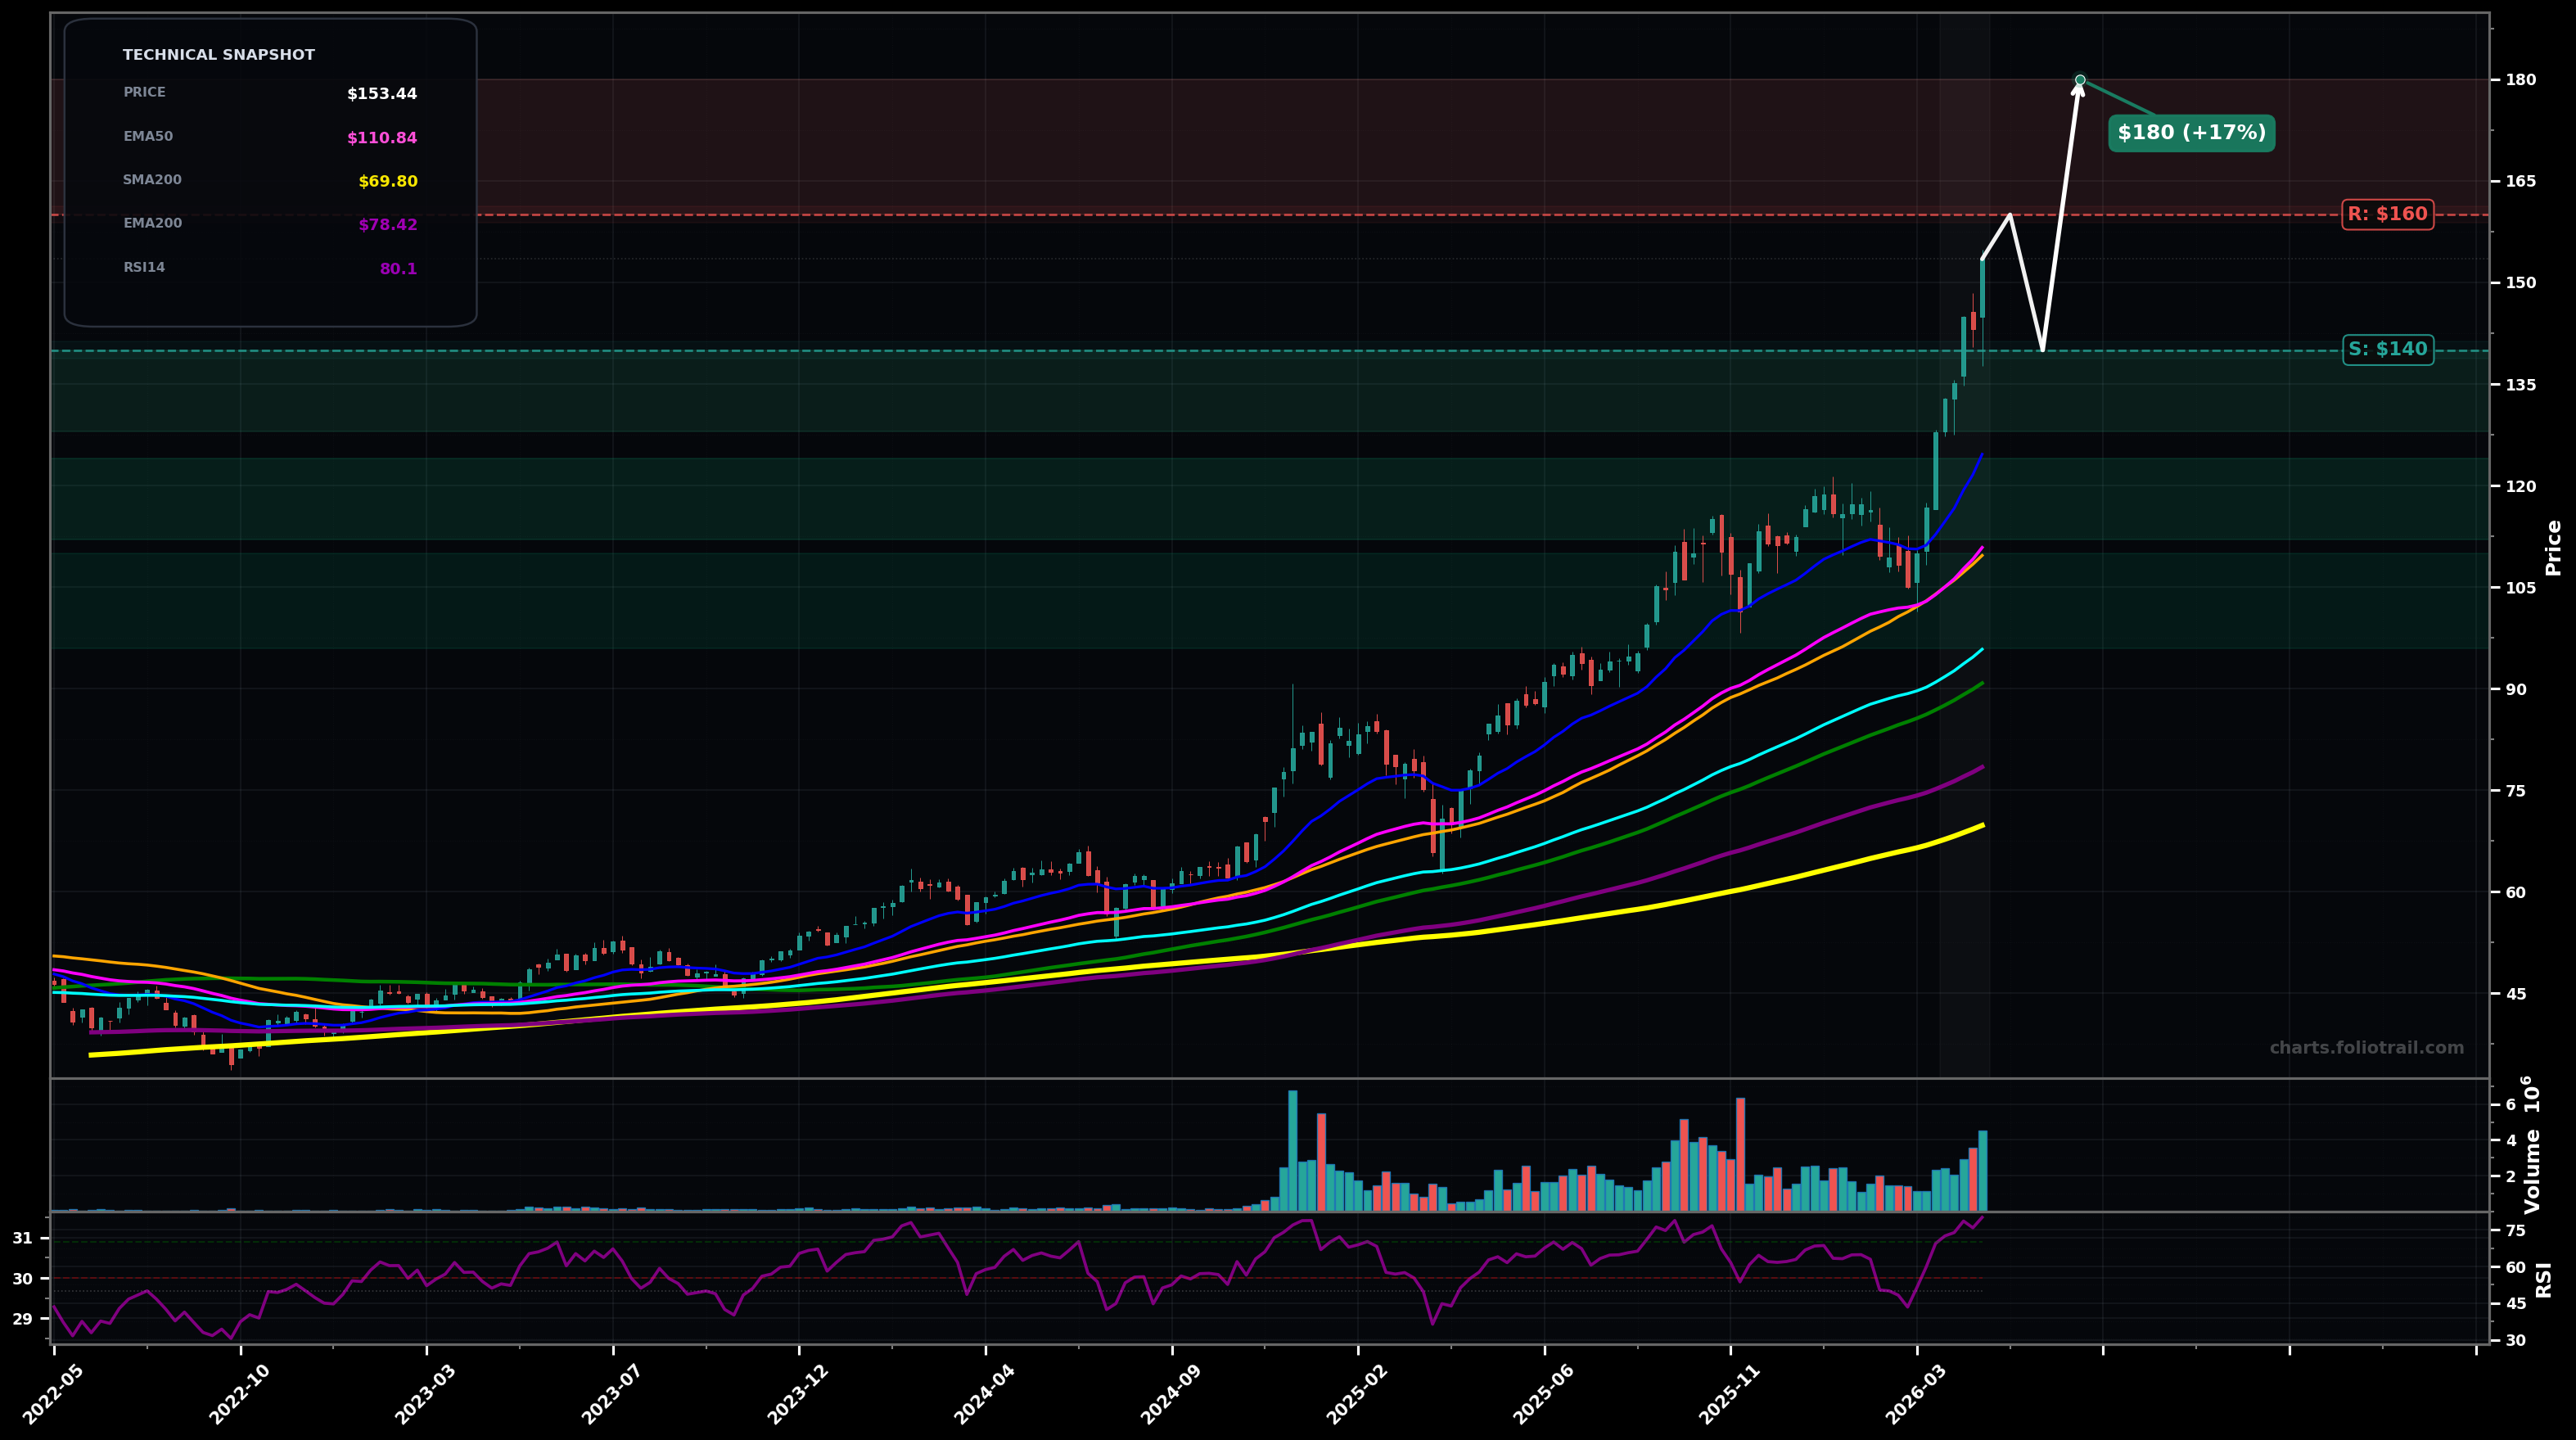
As of May 22, 2026, QTUM (Defiance Quantum ETF) is in a parabolic state on the weekly chart, with a confidence level of 74%. Key support is at $140 and key resistance at $160. Weekly trend is accelerating: price at $153.44 has broken to fresh highs with expanding candles/volume; RSI-14 is stretched (~80) and price is far above rising EMA50/EMA100.
Bullish continuation after a brief consolidation: shallow pullback/bull-flag holds above prior breakout zone, then resumes trend to the next extension.
Mean-reversion pullback: parabolic leg cools off into a deeper retrace toward fast MAs (EMA20/EMA50), then attempts a higher low for the next leg.
2+ weekly closes above $150 while holding above $140 on pullbacks
Weekly close below $128 (loss of the most recent swing-base area) with follow-through
Buy-the-dip only: $128-$140 = prior breakout/near swing support; $112-$124 = EMA50 region; $96-$110 = EMA100/SMA50 cluster for deeper retrace while trend remains up.
Trim into extension/overbought conditions: first at round-number extensions ($160-$180), more if price overshoots parabolically ($180-$210), and fully exit on extreme multi-year stretch ($210-$260) vs rising long MAs.
As of May 22, 2026, QTUM (Defiance Quantum ETF) is in a parabolic state on the weekly chart with 74% confidence. Weekly trend is accelerating: price at $153.44 has broken to fresh highs with expanding candles/volume; RSI-14 is stretched (~80) and price is far above rising EMA50/EMA100.
On the weekly timeframe, QTUM has key support at $140 and key resistance at $160. The most likely scenario (bullish) targets $160 and $180, with a revert level at $140.
QTUM (Defiance Quantum ETF) is currently classified as parabolic on the weekly chart, with 74% confidence. Confirmation requires: 2+ weekly closes above $150 while holding above $140 on pullbacks This would be invalidated by: Weekly close below $128 (loss of the most recent swing-base area) with follow-through
The most likely scenario (bullish) targets $160 and $180, with a revert level at $140. The alternative scenario (bearish) targets $128 and $112.
Multi-layer AI agents analyse 200+ stocks across daily, weekly, and monthly timeframes — producing market state classifications, price scenarios with targets, and position entry/exit levels. Daily charts updated every trading day at 6 PM ET. Weekly charts refresh Fridays. Monthly charts refresh on the last trading day of each month. No paywall. No sign-up required.
Built by Foliotrail.
All content on this website — including charts, analysis, price targets, support/resistance levels, and position zones — is generated entirely by AI and provided for educational and informational purposes only.
This is not financial advice. NEXUSNOIR VENTURES SL (the operator of this website) is not a registered investment adviser or broker-dealer. You should not make investment decisions based solely on this information. Always do your own research and consult a qualified financial advisor.
By continuing, you acknowledge that you have read and agree to our full disclaimer & terms of use and privacy policy.