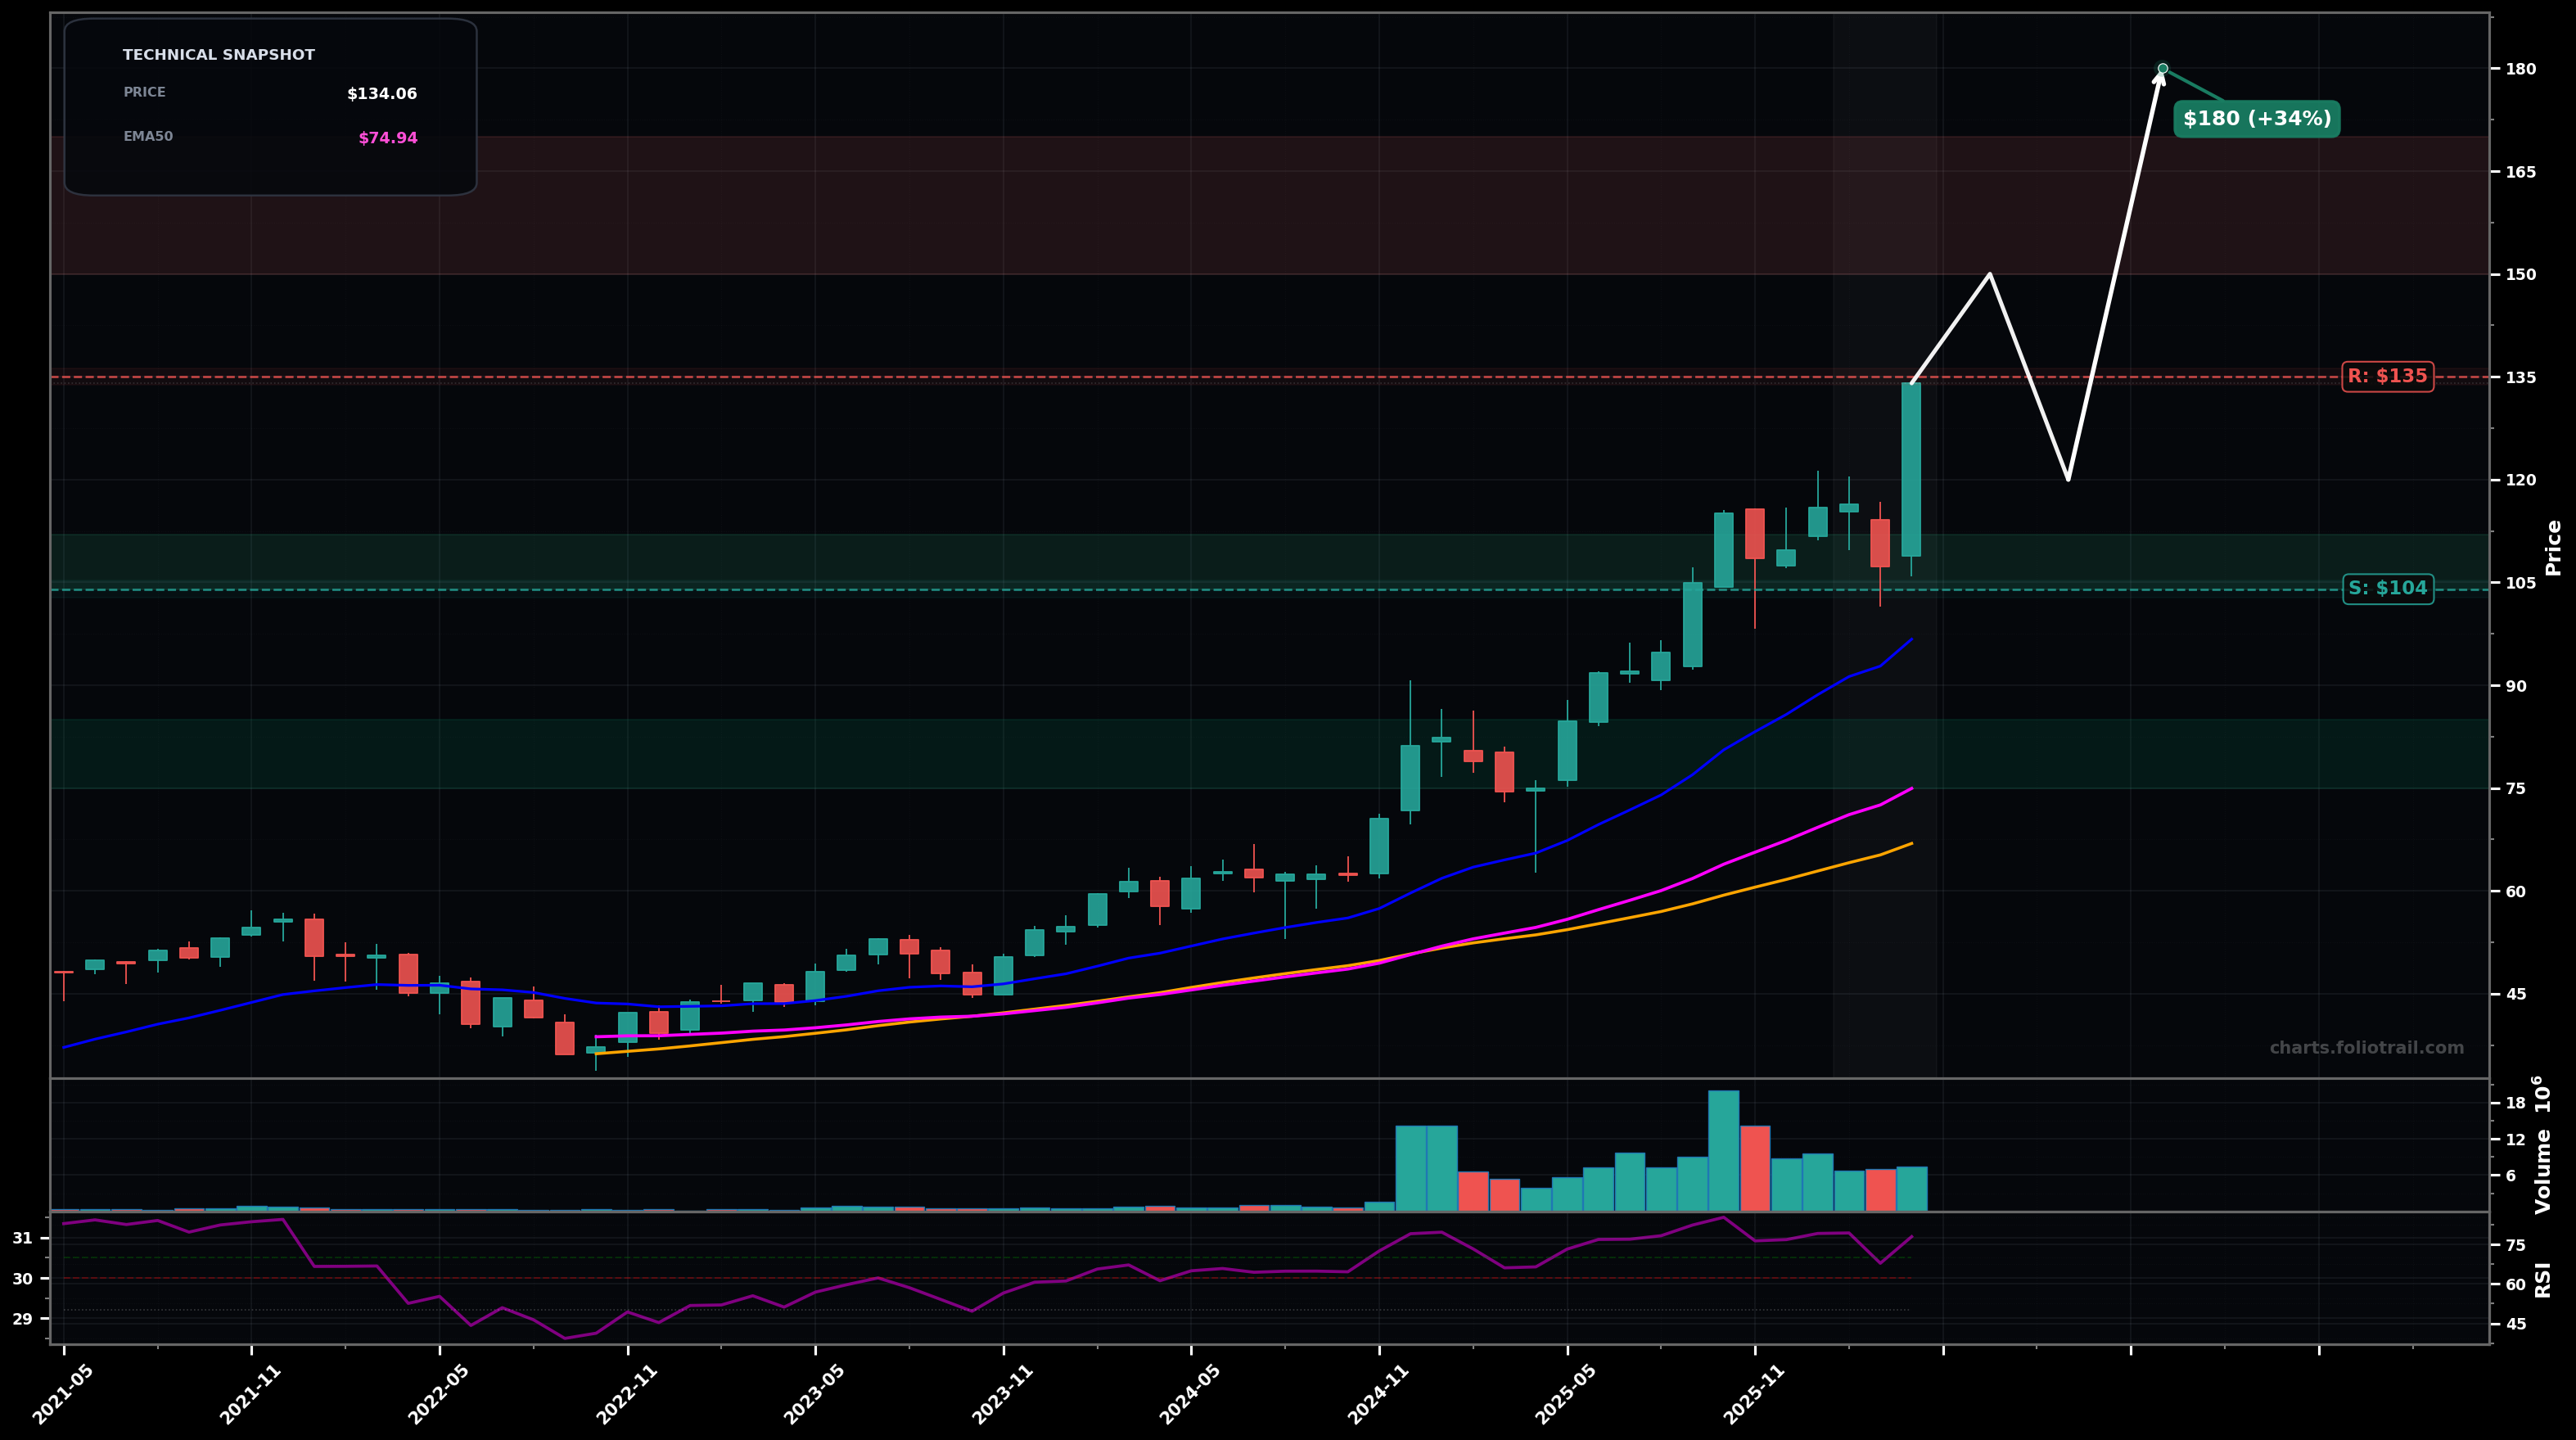
As of April 30, 2026, QTUM (Defiance Quantum ETF) is in a parabolic state on the monthly chart, with a confidence level of 72%. Key support is at $104 and key resistance at $135. Monthly impulse continuation: strong green candle pushing to new swing highs; price extended above rising EMA50 ($74.94) and EMA200 ($96.72); RSI ~77.9 (overbought zone).
Bullish continuation as a Wave 3/Wave 5 extension: after a brief consolidation, QTUM grinds higher and tests the prior high zone then extends to the next fib projection.
Mean-reversion pullback (parabolic unwind): price rejects near the top, retraces toward fib supports and moving-average magnet levels before attempting another leg up.
Hold above $120 on a monthly closing basis (no loss of momentum after the spike).
Monthly close back below $104 (breaks most recent swing-low support and implies deeper mean reversion).
Buy-the-dip plan uses last swing-low support (~$104), then EMA200 area (~$97), with worst-case capitulation/major trend support near EMA50 (~$75) for higher R:R entries.
Trims scale into fib extensions above the recent breakout high (~$135): first into 1.272–1.414 (~$150–$170), heavier into 1.618 area (~$180–$210), and full exit into larger extension blow-off risk (~$240+).
As of April 30, 2026, QTUM (Defiance Quantum ETF) is in a parabolic state on the monthly chart with 72% confidence. Monthly impulse continuation: strong green candle pushing to new swing highs; price extended above rising EMA50 ($74.94) and EMA200 ($96.72); RSI ~77.9 (overbought zone).
On the monthly timeframe, QTUM has key support at $104 and key resistance at $135. The most likely scenario (bullish) targets $150 and $180, with a revert level at $120.
QTUM (Defiance Quantum ETF) is currently classified as parabolic on the monthly chart, with 72% confidence. Confirmation requires: Hold above $120 on a monthly closing basis (no loss of momentum after the spike). This would be invalidated by: Monthly close back below $104 (breaks most recent swing-low support and implies deeper mean reversion).
The most likely scenario (bullish) targets $150 and $180, with a revert level at $120. The alternative scenario (bearish) targets $104 and $97.0.
Multi-layer AI agents analyse 200+ stocks across daily, weekly, and monthly timeframes — producing market state classifications, price scenarios with targets, and position entry/exit levels. Daily charts updated every trading day at 6 PM ET. Weekly charts refresh Fridays. Monthly charts refresh on the last trading day of each month. No paywall. No sign-up required.
Built by Foliotrail.
All content on this website — including charts, analysis, price targets, support/resistance levels, and position zones — is generated entirely by AI and provided for educational and informational purposes only.
This is not financial advice. NEXUSNOIR VENTURES SL (the operator of this website) is not a registered investment adviser or broker-dealer. You should not make investment decisions based solely on this information. Always do your own research and consult a qualified financial advisor.
By continuing, you acknowledge that you have read and agree to our full disclaimer & terms of use and privacy policy.