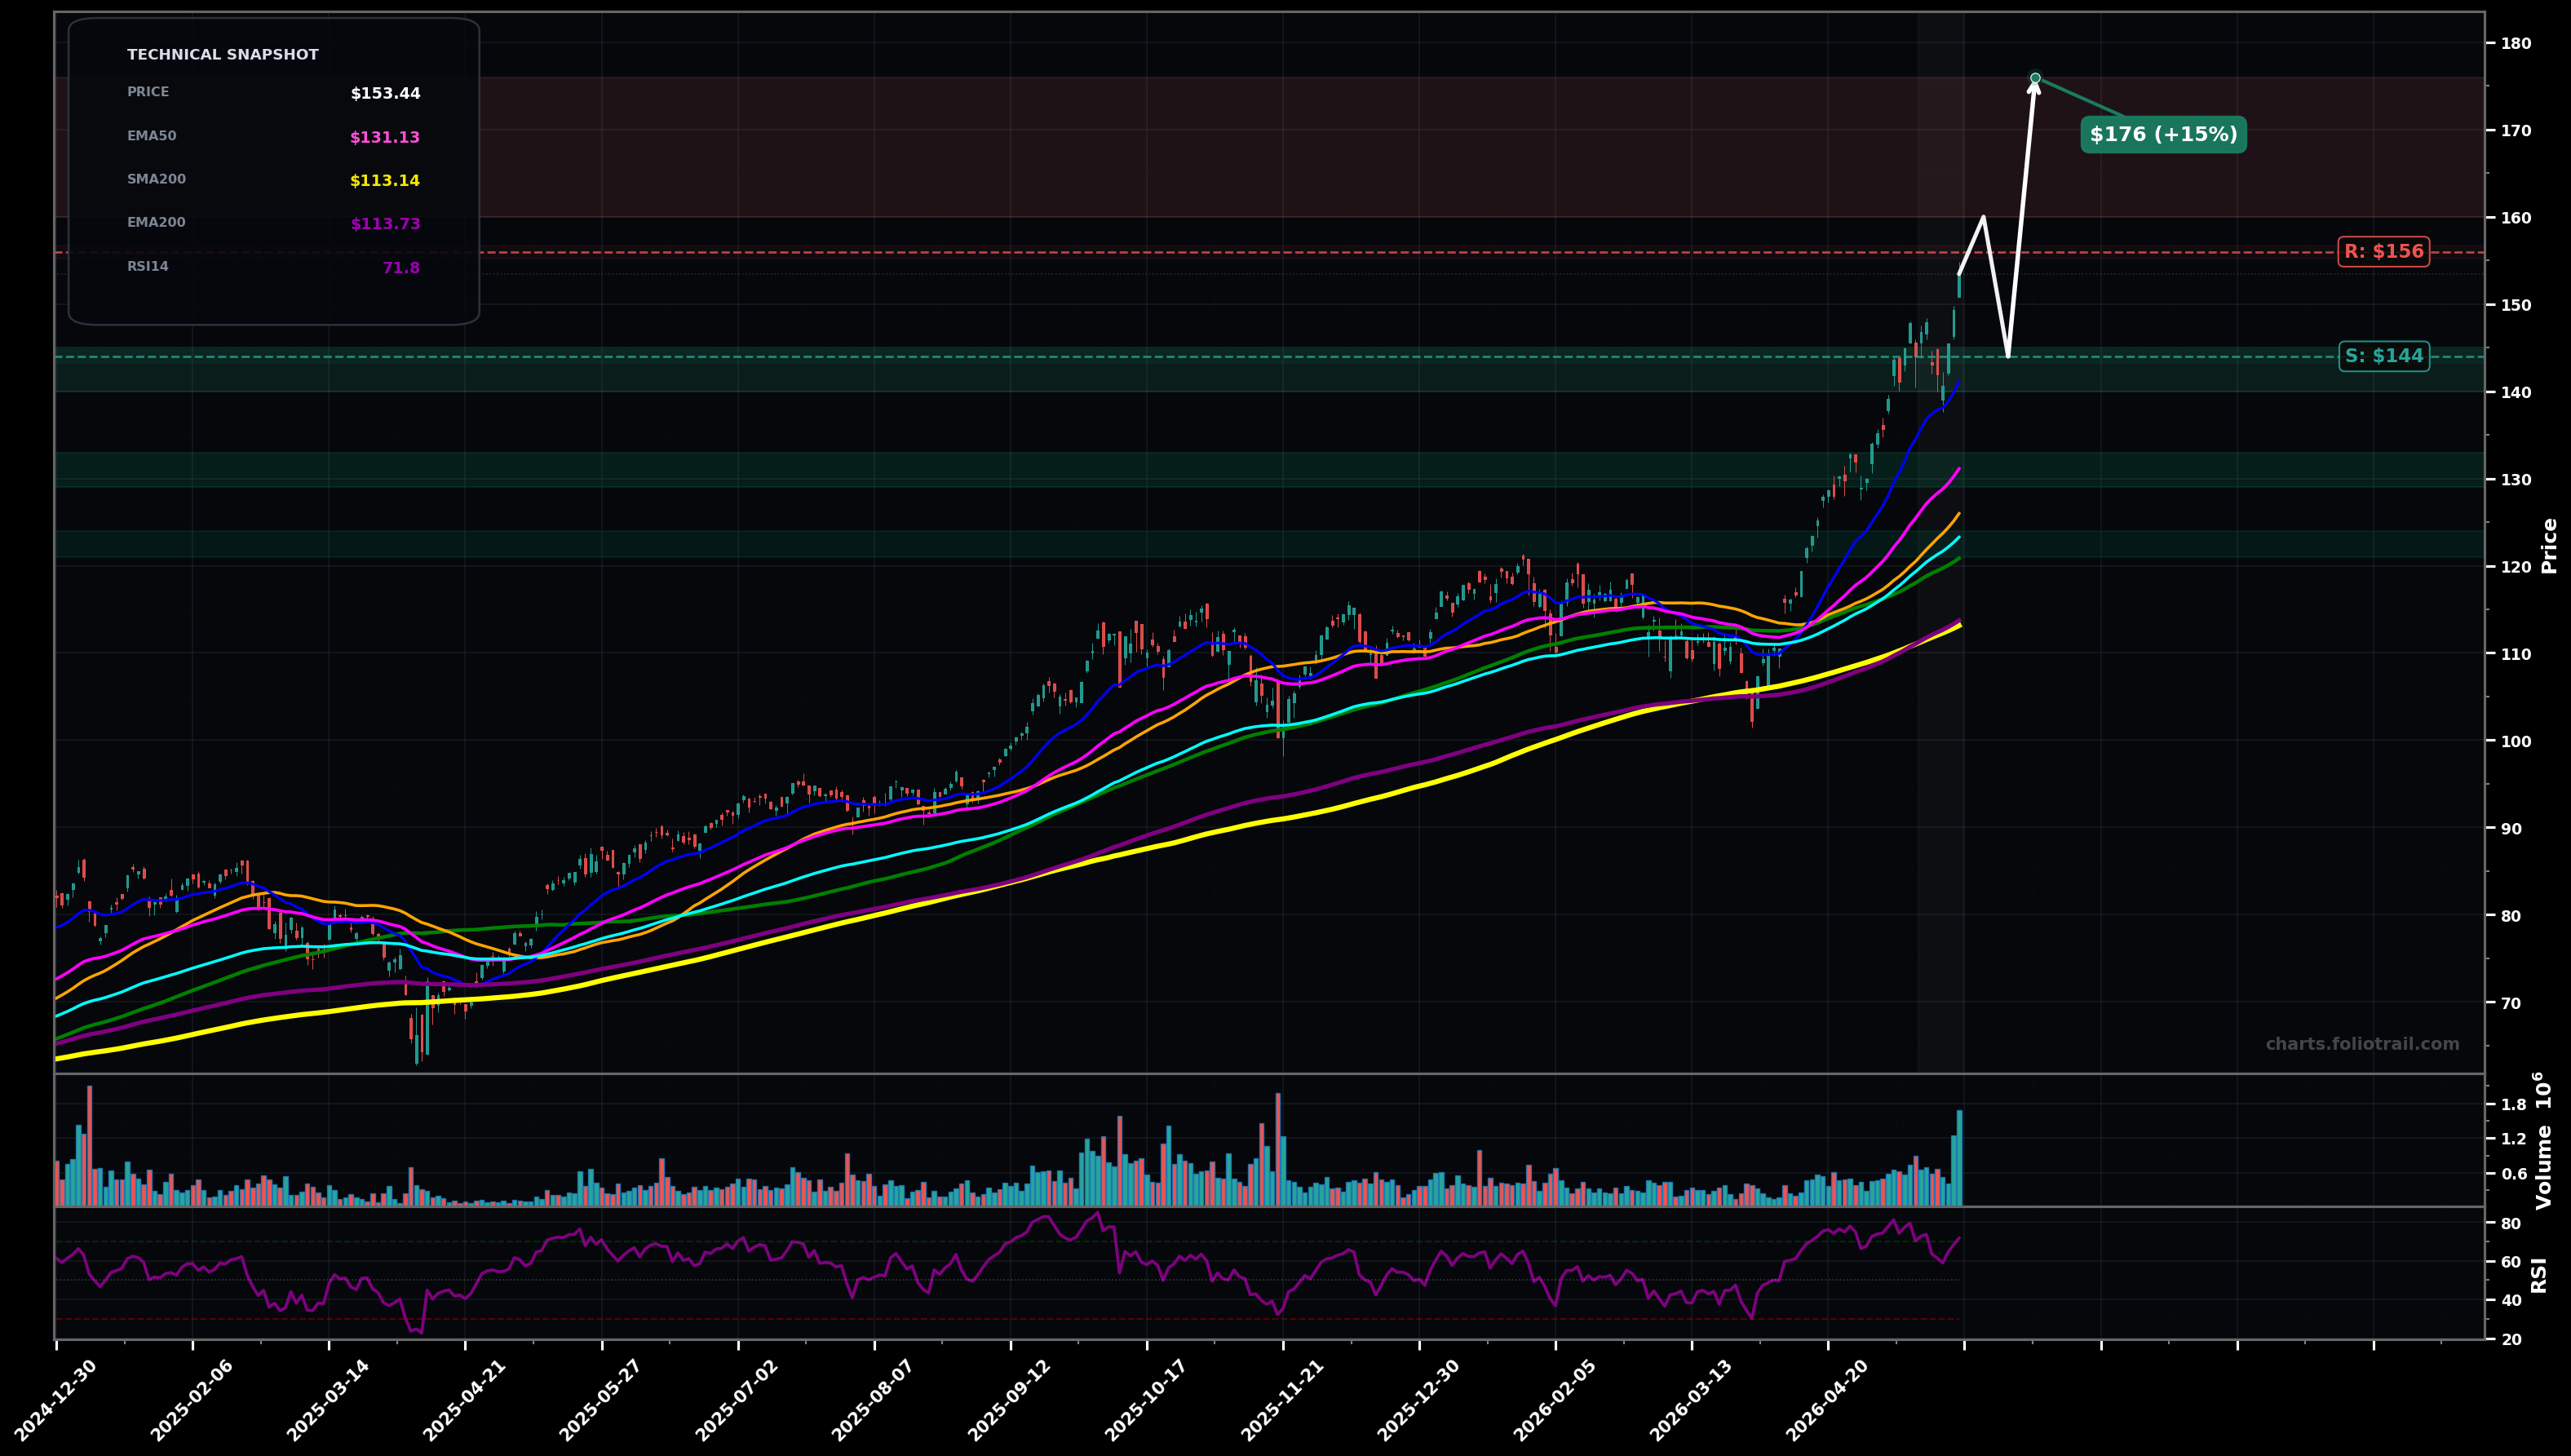
As of May 22, 2026, QTUM (Defiance Quantum ETF) is in a uptrend state on the daily chart, with a confidence level of 78%. Key support is at $144 and key resistance at $156. Strong impulsive push to new highs; price ($153.44) extended above rising EMA50/EMA100 with RSI-14 ~$71.8 and expanding volume into the breakout.
Bullish continuation (likely Wave 5 / late Wave 3 extension): brief pullback/flag above prior breakout zone, then trend resumes higher; watch for Fib extension progress with momentum cooling but no major breakdown.
Deeper mean-reversion (Wave 4-style) after the vertical leg: rejection near highs leads to a larger pullback toward dynamic supports (EMA50 then EMA100) before buyers re-assert; risk increases if a large red close near lows appears on high volume.
2+ daily closes holding above $144.00
Daily close below $131.00 (loss of EMA50 trend support)
Buy-the-dip framework: $140-$145 = prior breakout/near-term pivot, $129-$133 = EMA50 support, $121-$124 = EMA100 confluence/previous consolidation top.
Trim into likely Fib extensions and euphoric spacing from EMA50/EMA100 (RSI already elevated); progressively de-risk as price becomes increasingly stretched versus the multi-month base.
As of May 22, 2026, QTUM (Defiance Quantum ETF) is in a uptrend state on the daily chart with 78% confidence. Strong impulsive push to new highs; price ($153.44) extended above rising EMA50/EMA100 with RSI-14 ~$71.8 and expanding volume into the breakout.
On the daily timeframe, QTUM has key support at $144 and key resistance at $156. The most likely scenario (bullish) targets $160 and $176, with a revert level at $144.
QTUM (Defiance Quantum ETF) is currently classified as uptrend on the daily chart, with 78% confidence. Confirmation requires: 2+ daily closes holding above $144.00 This would be invalidated by: Daily close below $131.00 (loss of EMA50 trend support)
The most likely scenario (bullish) targets $160 and $176, with a revert level at $144. The alternative scenario (bearish) targets $131 and $123.
Multi-layer AI agents analyse 200+ stocks across daily, weekly, and monthly timeframes — producing market state classifications, price scenarios with targets, and position entry/exit levels. Daily charts updated every trading day at 6 PM ET. Weekly charts refresh Fridays. Monthly charts refresh on the last trading day of each month. No paywall. No sign-up required.
Built by Foliotrail.
All content on this website — including charts, analysis, price targets, support/resistance levels, and position zones — is generated entirely by AI and provided for educational and informational purposes only.
This is not financial advice. NEXUSNOIR VENTURES SL (the operator of this website) is not a registered investment adviser or broker-dealer. You should not make investment decisions based solely on this information. Always do your own research and consult a qualified financial advisor.
By continuing, you acknowledge that you have read and agree to our full disclaimer & terms of use and privacy policy.