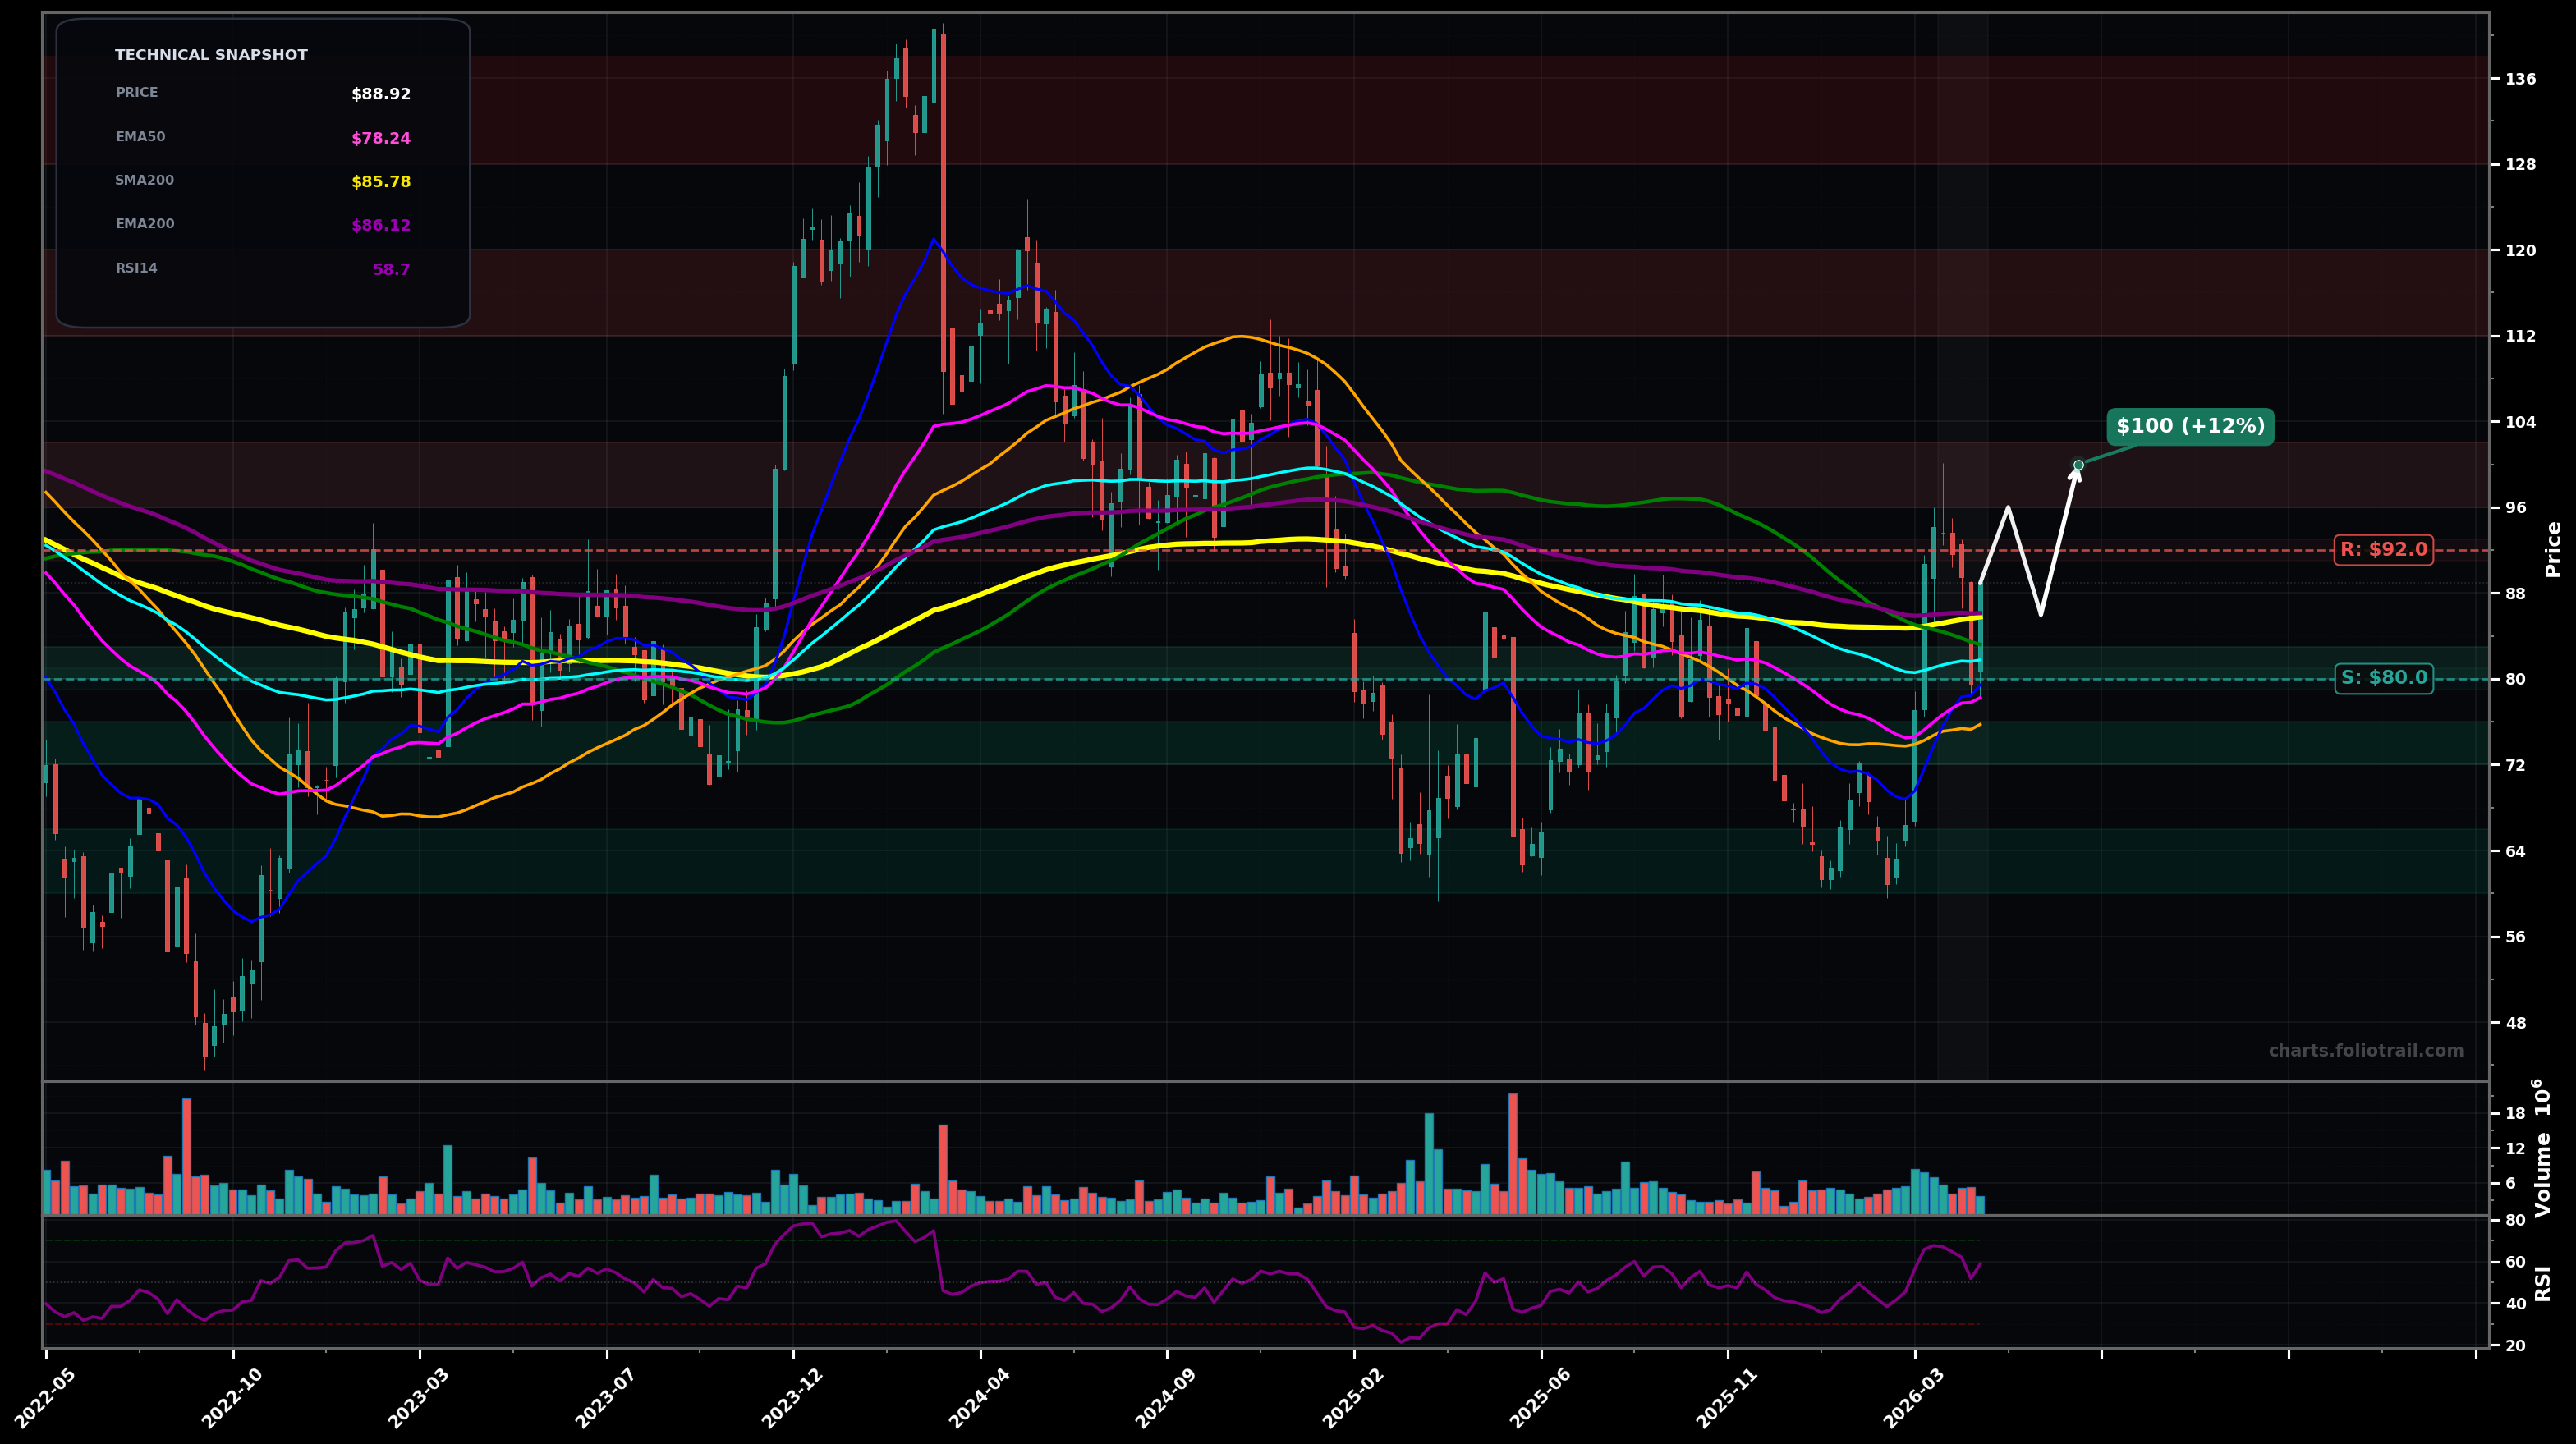
As of May 22, 2026, PVH (PVH Corp.) is in a choppy range state on the weekly chart, with a confidence level of 66%. Key support is at $80.0 and key resistance at $92.0. Weekly bounce from the ~$60s produced a sharp rally into the MA cluster; price (~$88.92) is stalling near SMA200/EMA200 with a small pullback after a rejection wick.
Base-building continues: pullback holds ~$80-$83 then price reclaims the $86-$90 MA band and pushes to test the prior supply near ~$96-$100 (range rotation). Rough probability: 55%.
Failure at the MA cluster: loses ~$80, triggering a deeper retrace toward the prior swing low zone in the low-$70s and possibly a full retest of the ~$60s base. Rough probability: 45%.
2 weekly closes above $92 holding above SMA200 ($85.78) and EMA200 ($86.12).
Weekly close below $80 (loss of EMA50 $78.24/nearby structure support).
$80-$83 is the first structural support/EMA50 area; $72-$76 aligns with prior breakdown/mean-reversion zone; $60-$66 is the recent major swing-low demand where the rally impulse started.
Trim into prior supply and fib-extension risk: first near ~$100 (range top), heavier into ~$112-$120 (prior distribution/upper band), and fully into ~$128-$138 (major prior peak zone / extended move).
As of May 22, 2026, PVH (PVH Corp.) is in a choppy range state on the weekly chart with 66% confidence. Weekly bounce from the ~$60s produced a sharp rally into the MA cluster; price (~$88.92) is stalling near SMA200/EMA200 with a small pullback after a rejection wick.
On the weekly timeframe, PVH has key support at $80.0 and key resistance at $92.0. The most likely scenario (bullish) targets $96.0 and $100, with a revert level at $86.0.
PVH (PVH Corp.) is currently classified as choppy range on the weekly chart, with 66% confidence. Confirmation requires: 2 weekly closes above $92 holding above SMA200 ($85.78) and EMA200 ($86.12). This would be invalidated by: Weekly close below $80 (loss of EMA50 $78.24/nearby structure support).
The most likely scenario (bullish) targets $96.0 and $100, with a revert level at $86.0. The alternative scenario (bearish) targets $72.0 and $62.0.
Multi-layer AI agents analyse 200+ stocks across daily, weekly, and monthly timeframes — producing market state classifications, price scenarios with targets, and position entry/exit levels. Daily charts updated every trading day at 6 PM ET. Weekly charts refresh Fridays. Monthly charts refresh on the last trading day of each month. No paywall. No sign-up required.
Built by Foliotrail.
All content on this website — including charts, analysis, price targets, support/resistance levels, and position zones — is generated entirely by AI and provided for educational and informational purposes only.
This is not financial advice. NEXUSNOIR VENTURES SL (the operator of this website) is not a registered investment adviser or broker-dealer. You should not make investment decisions based solely on this information. Always do your own research and consult a qualified financial advisor.
By continuing, you acknowledge that you have read and agree to our full disclaimer & terms of use and privacy policy.