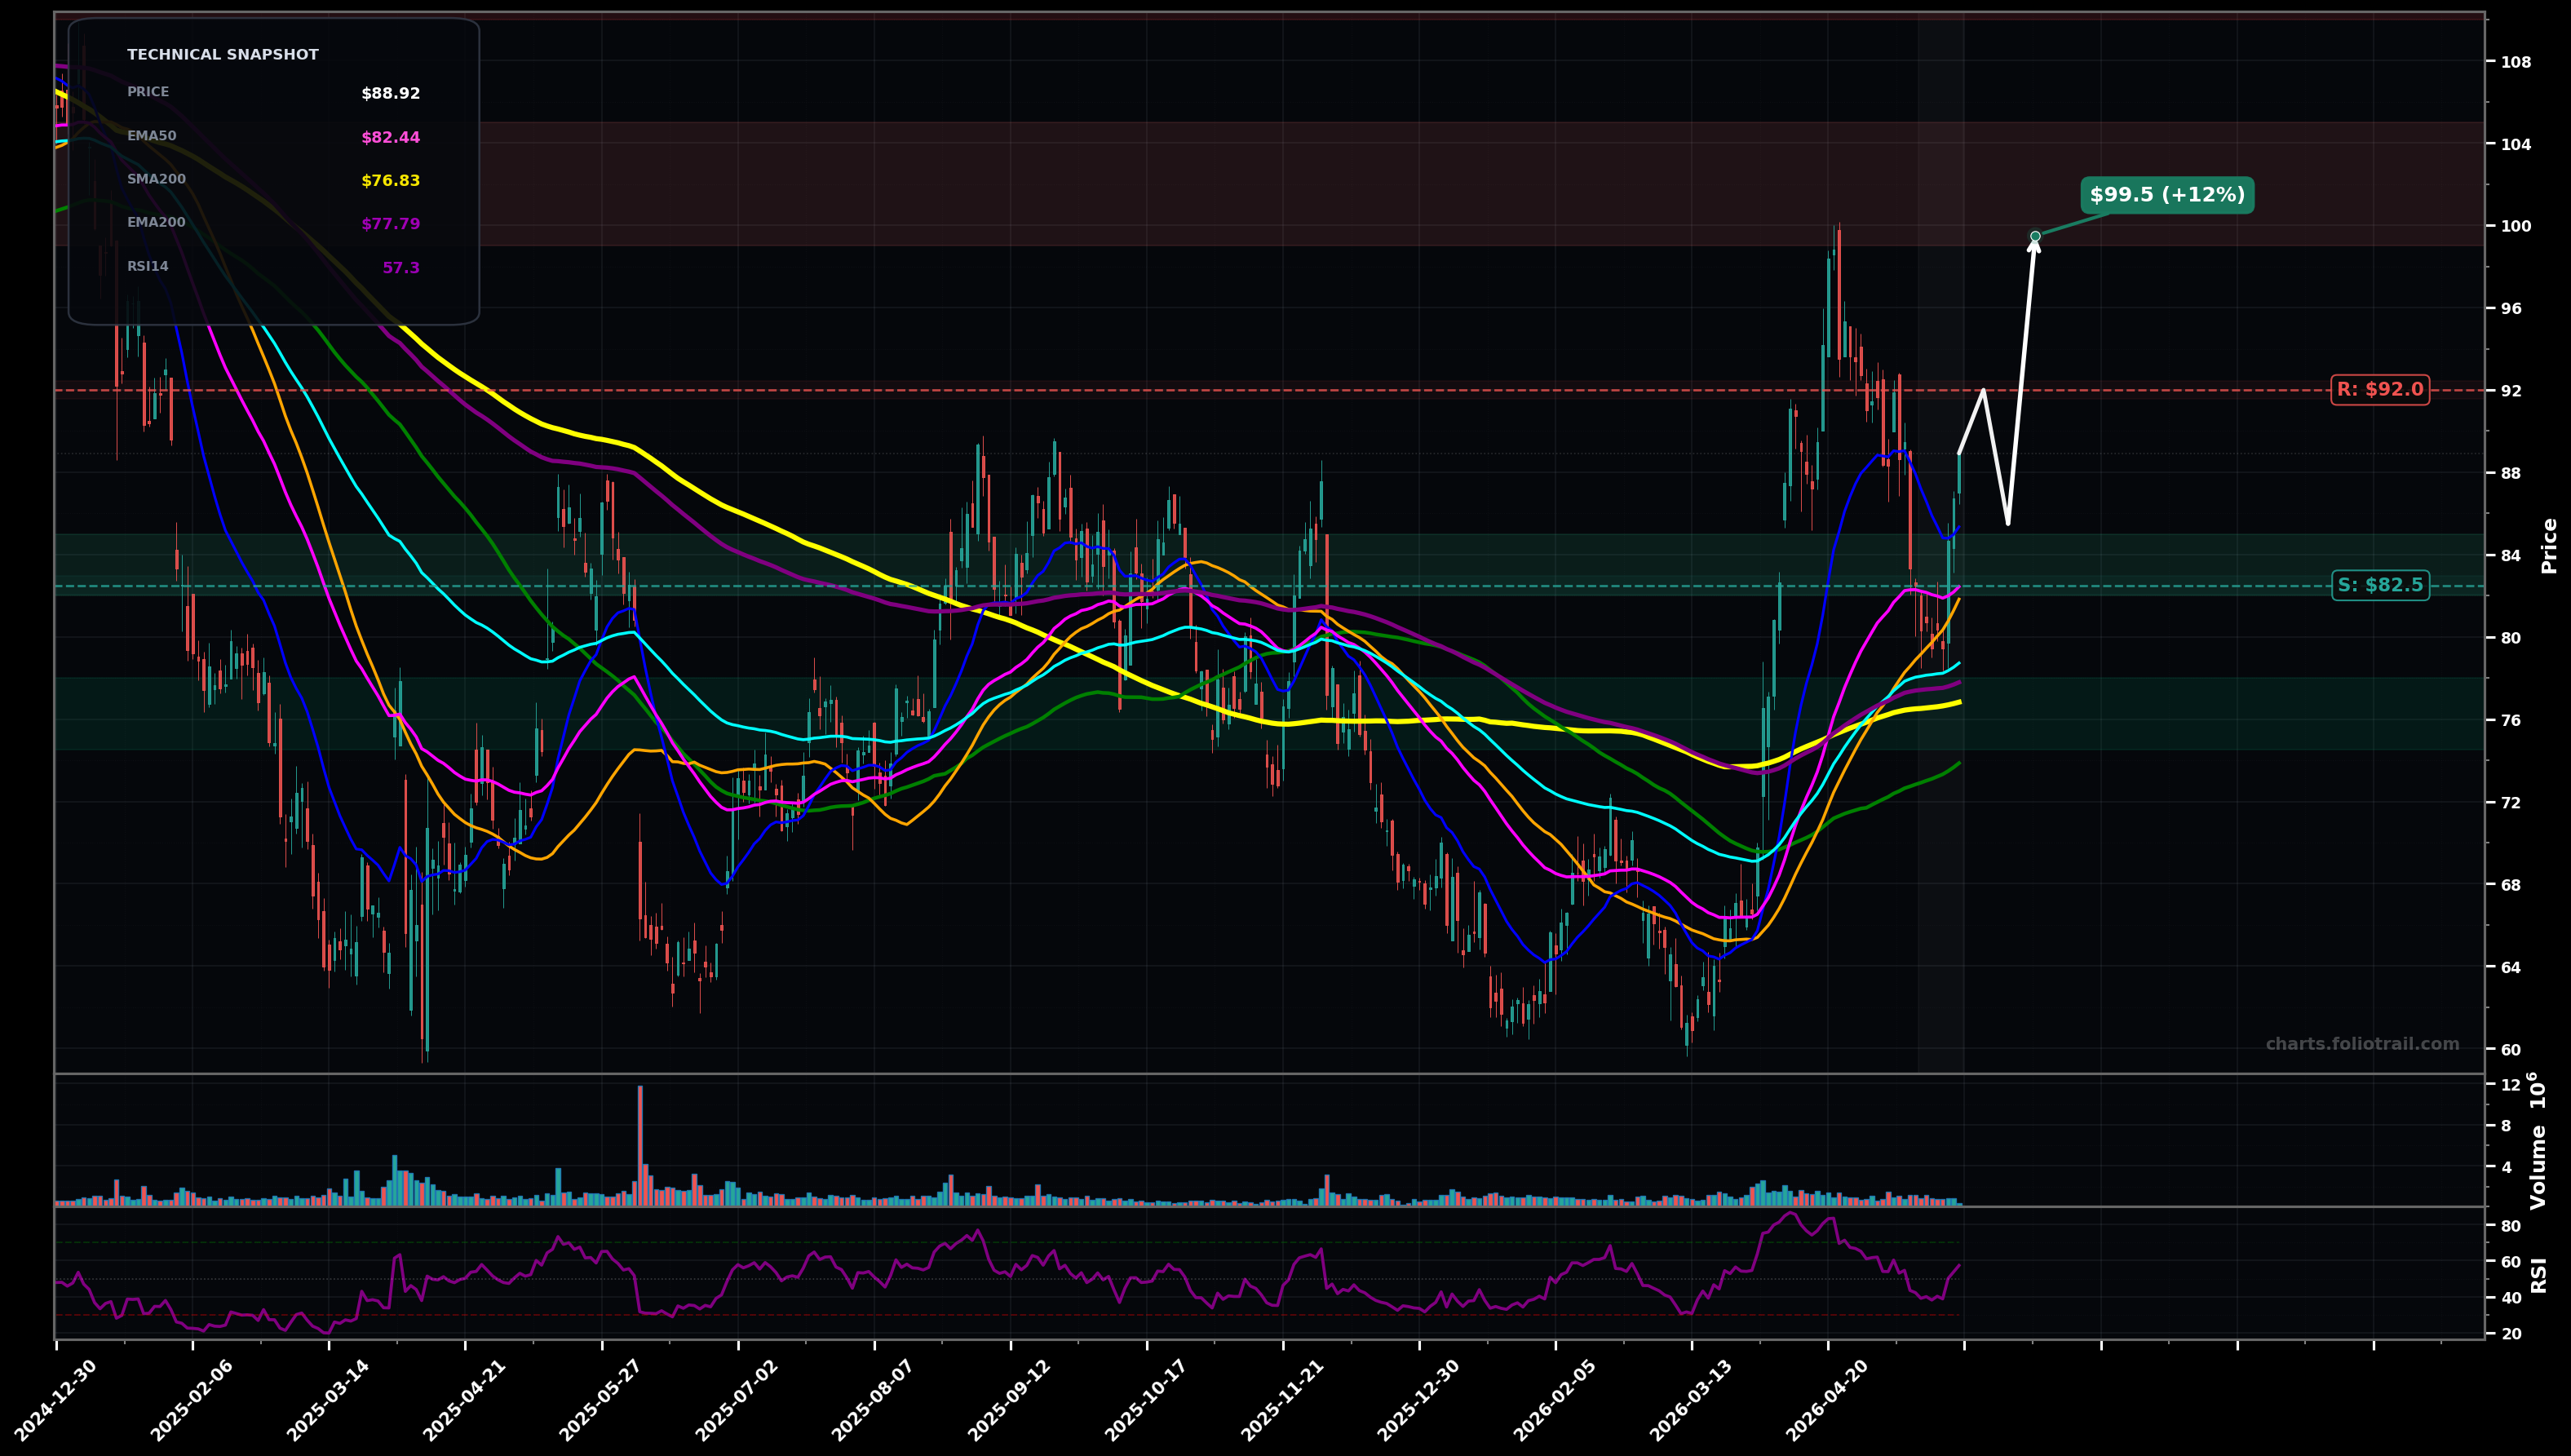
As of May 22, 2026, PVH (PVH Corp.) is in a breakout reversal state on the daily chart, with a confidence level of 63%. Key support is at $82.5 and key resistance at $92.0. Price at ~$88.92 rebounded from the ~$84 area and is attempting to reclaim the rising short-term averages; RSI14 ~57 shows improving momentum after the April pullback from ~$100.
Base continuation: price grinds higher, clears $92 and retests the prior supply zone near the April breakdown, with a chance to re-attack the ~$100 swing high (Elliott: likely wave 3/5 continuation off the March low; Fib: 0.618-0.786 retrace area aligns near low-$90s then extension toward ~$100).
Failed reclaim / range rejection: price stalls under $92, rolls over to retest the moving-average cluster; if $80-$82 breaks, momentum shifts back toward the larger base supports near the $76-$78 zone (Elliott: could be a corrective ABC where the current bounce is a B-wave before a C-wave lower).
2+ daily closes above $92.00 (clears the recent swing resistance zone) while holding above $82.50
Daily close below $80.00 (loses EMA100 region and breaks the latest higher-low structure)
Bias is buy-the-dip above the rising EMA50/EMA100; add toward EMA200/SMA200 confluence (~$76-$78) where prior base support sits; heavy add only on deeper mean reversion into long-MA support.
Trim into prior swing-high supply (~$100) and potential Fib extension zones; increase trimming if price becomes stretched far above EMA50/EMA100 with momentum overheating; fully exit into a multi-year stretch/extension band.
As of May 22, 2026, PVH (PVH Corp.) is in a breakout reversal state on the daily chart with 63% confidence. Price at ~$88.92 rebounded from the ~$84 area and is attempting to reclaim the rising short-term averages; RSI14 ~57 shows improving momentum after the April pullback from ~$100.
On the daily timeframe, PVH has key support at $82.5 and key resistance at $92.0. The most likely scenario (bullish) targets $92.0 and $99.5, with a revert level at $85.5.
PVH (PVH Corp.) is currently classified as breakout reversal on the daily chart, with 63% confidence. Confirmation requires: 2+ daily closes above $92.00 (clears the recent swing resistance zone) while holding above $82.50 This would be invalidated by: Daily close below $80.00 (loses EMA100 region and breaks the latest higher-low structure)
The most likely scenario (bullish) targets $92.0 and $99.5, with a revert level at $85.5. The alternative scenario (bearish) targets $82.5 and $76.5.
Multi-layer AI agents analyse 200+ stocks across daily, weekly, and monthly timeframes — producing market state classifications, price scenarios with targets, and position entry/exit levels. Daily charts updated every trading day at 6 PM ET. Weekly charts refresh Fridays. Monthly charts refresh on the last trading day of each month. No paywall. No sign-up required.
Built by Foliotrail.
All content on this website — including charts, analysis, price targets, support/resistance levels, and position zones — is generated entirely by AI and provided for educational and informational purposes only.
This is not financial advice. NEXUSNOIR VENTURES SL (the operator of this website) is not a registered investment adviser or broker-dealer. You should not make investment decisions based solely on this information. Always do your own research and consult a qualified financial advisor.
By continuing, you acknowledge that you have read and agree to our full disclaimer & terms of use and privacy policy.