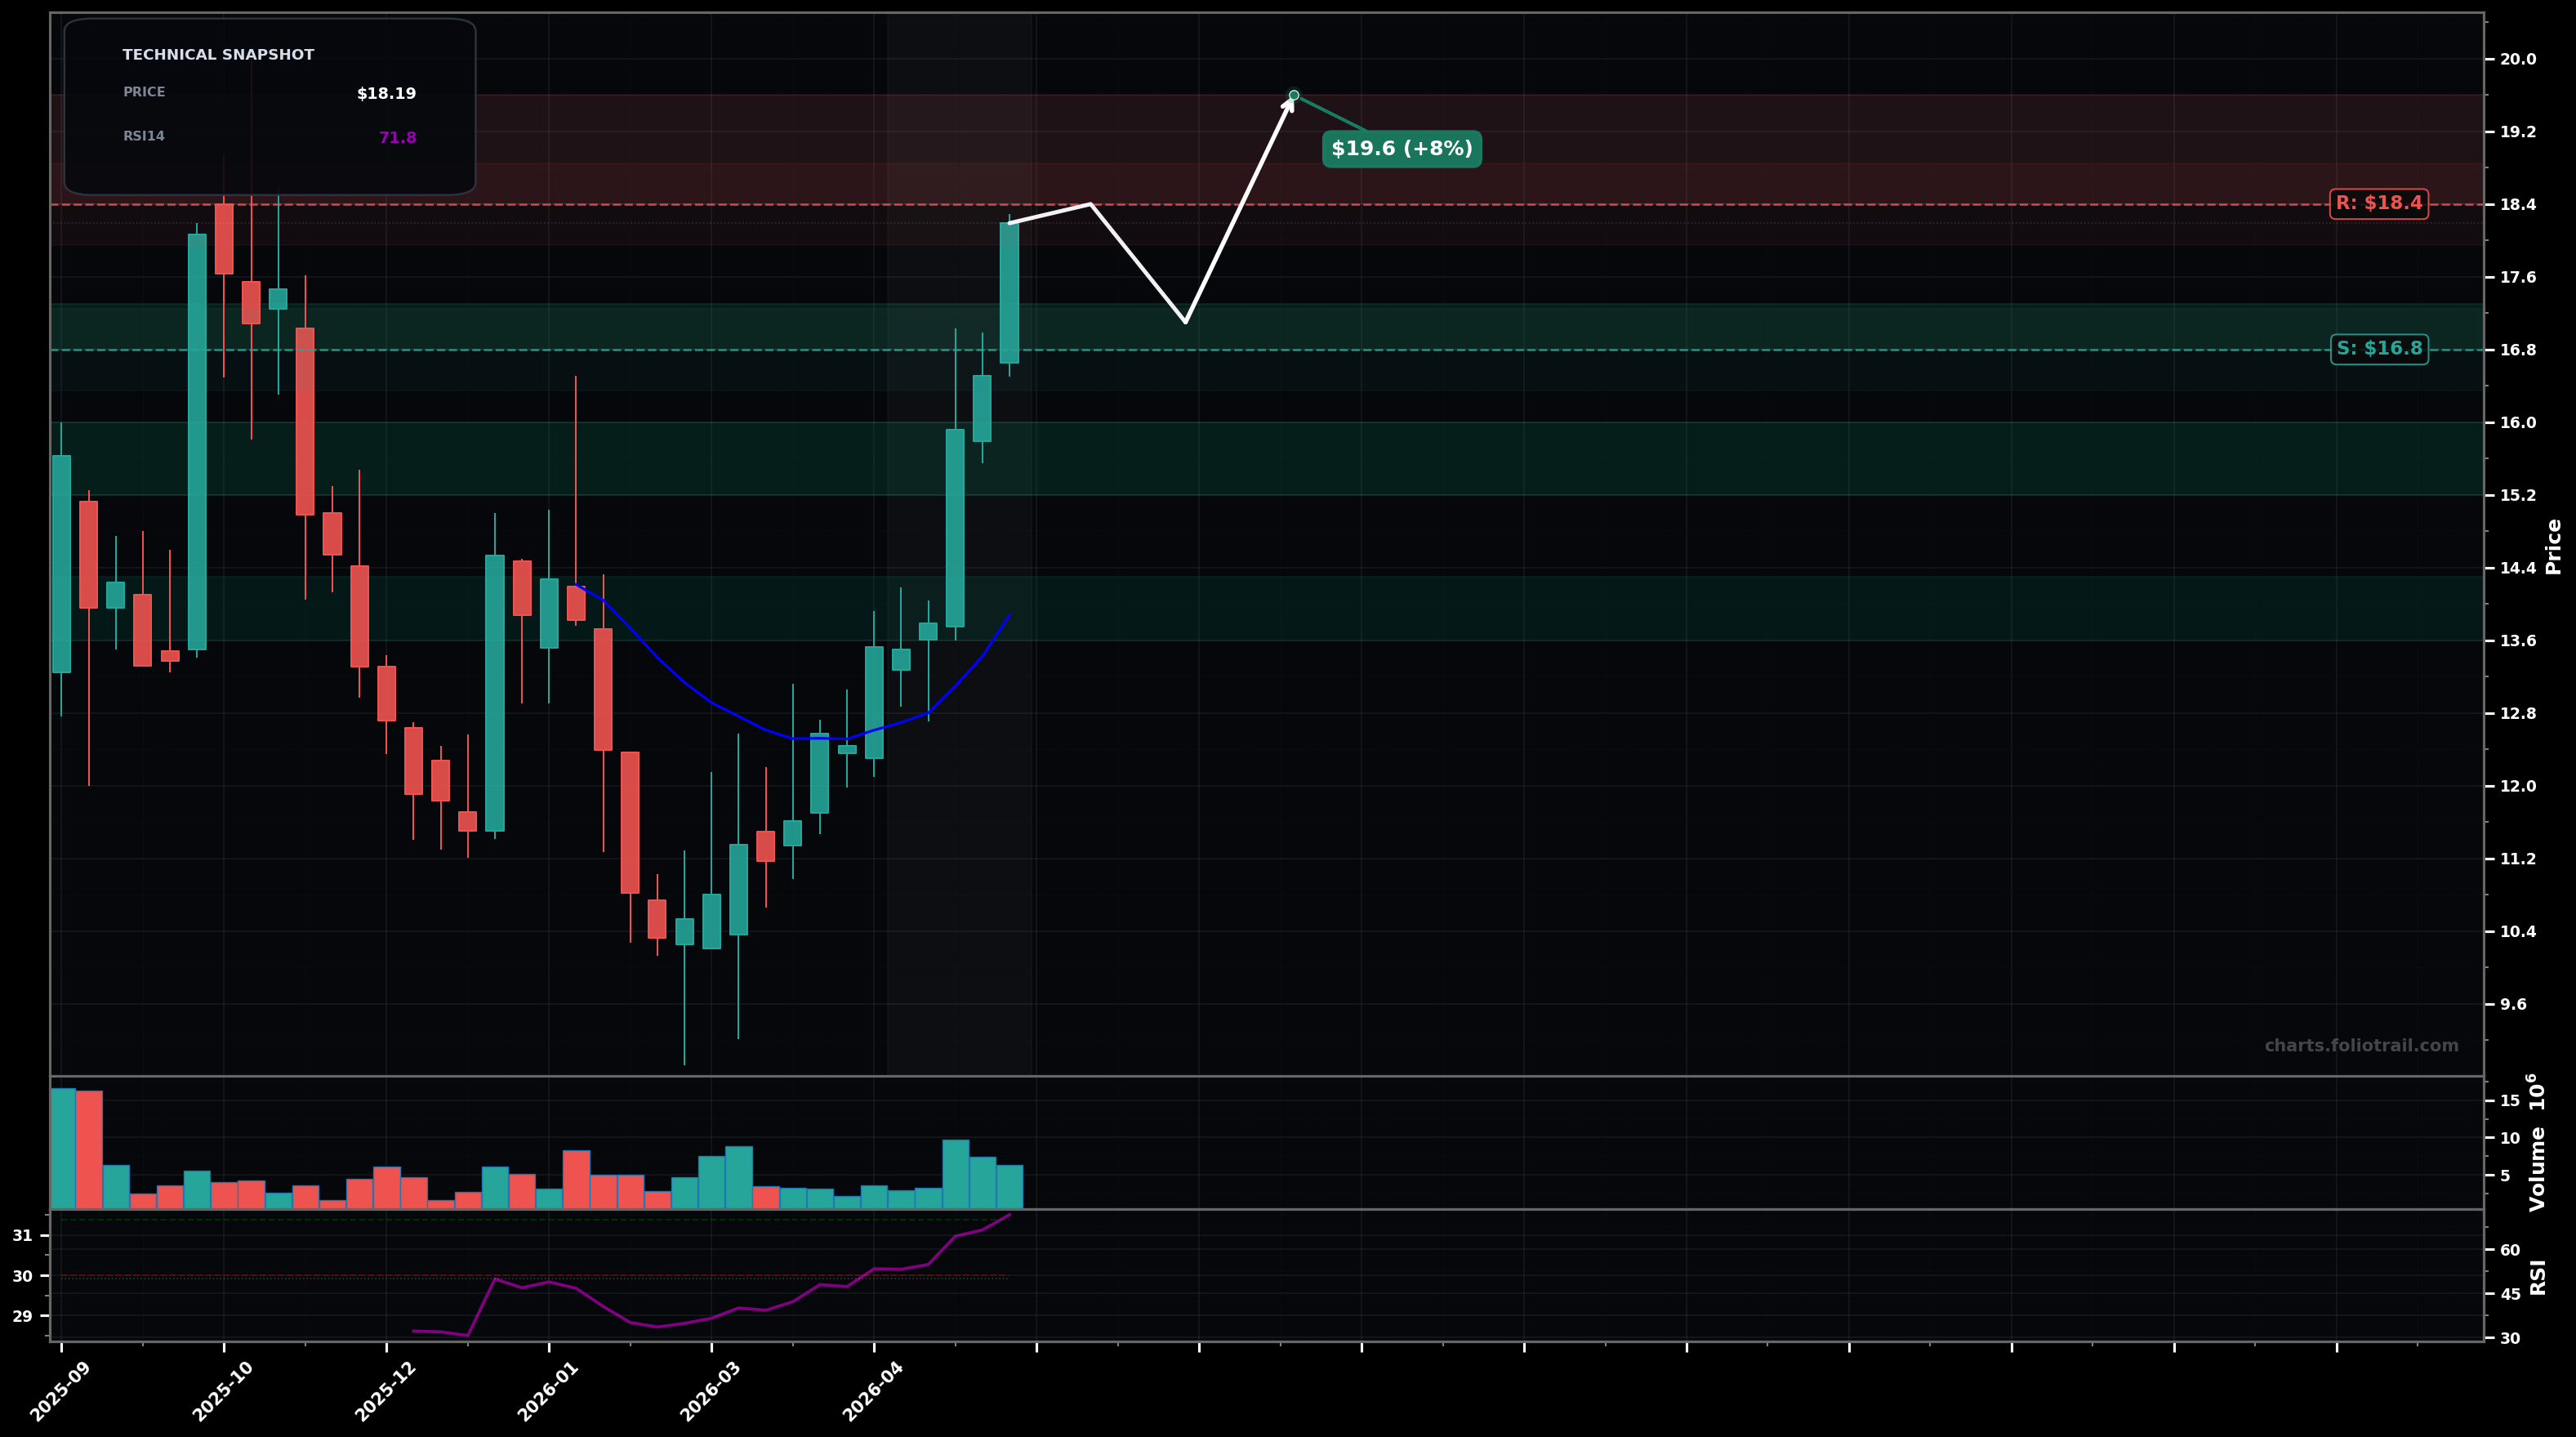
As of May 22, 2026, PTRN (Pattern Group Inc.) is in a parabolic state on the weekly chart, with a confidence level of 64%. Key support is at $16.8 and key resistance at $18.4. Weekly breakout leg: strong green candles pushed price to ~$18.19, extended above rising short-term trend line; RSI-14 ~71.8 (overbought/extended).
Bullish continuation with a brief consolidation/pullback then another push higher (likely Elliott Wave 3/5 style extension).
Mean-reversion after the parabolic stretch: pullback toward the breakout base/EMA zone before attempting another leg up (Elliott Wave: wave 4-type correction).
Weekly close above $18.40 with follow-through (hold above $18.00 next week).
Weekly close below $16.80 (loss of the breakout shelf/last impulsive base).
Buy-the-dip structure: $16.8 area is the breakout shelf; $15.2–$16.0 is prior consolidation; $13.6–$14.3 aligns with mean-reversion toward the rising EMA zone/swing structure support.
RSI-overbought + parabolic extension: trim into strength near $18.4–$19.6, increase trimming if price accelerates into $19.6–$21.2, and consider full exit if a blow-off extension reaches $21.2+ without building a base.
As of May 22, 2026, PTRN (Pattern Group Inc.) is in a parabolic state on the weekly chart with 64% confidence. Weekly breakout leg: strong green candles pushed price to ~$18.19, extended above rising short-term trend line; RSI-14 ~71.8 (overbought/extended).
On the weekly timeframe, PTRN has key support at $16.8 and key resistance at $18.4. The most likely scenario (bullish) targets $18.4 and $19.6, with a revert level at $17.1.
PTRN (Pattern Group Inc.) is currently classified as parabolic on the weekly chart, with 64% confidence. Confirmation requires: Weekly close above $18.40 with follow-through (hold above $18.00 next week). This would be invalidated by: Weekly close below $16.80 (loss of the breakout shelf/last impulsive base).
The most likely scenario (bullish) targets $18.4 and $19.6, with a revert level at $17.1. The alternative scenario (bearish) targets $16.8 and $14.2.
Multi-layer AI agents analyse 200+ stocks across daily, weekly, and monthly timeframes — producing market state classifications, price scenarios with targets, and position entry/exit levels. Daily charts updated every trading day at 6 PM ET. Weekly charts refresh Fridays. Monthly charts refresh on the last trading day of each month. No paywall. No sign-up required.
Built by Foliotrail.
All content on this website — including charts, analysis, price targets, support/resistance levels, and position zones — is generated entirely by AI and provided for educational and informational purposes only.
This is not financial advice. NEXUSNOIR VENTURES SL (the operator of this website) is not a registered investment adviser or broker-dealer. You should not make investment decisions based solely on this information. Always do your own research and consult a qualified financial advisor.
By continuing, you acknowledge that you have read and agree to our full disclaimer & terms of use and privacy policy.