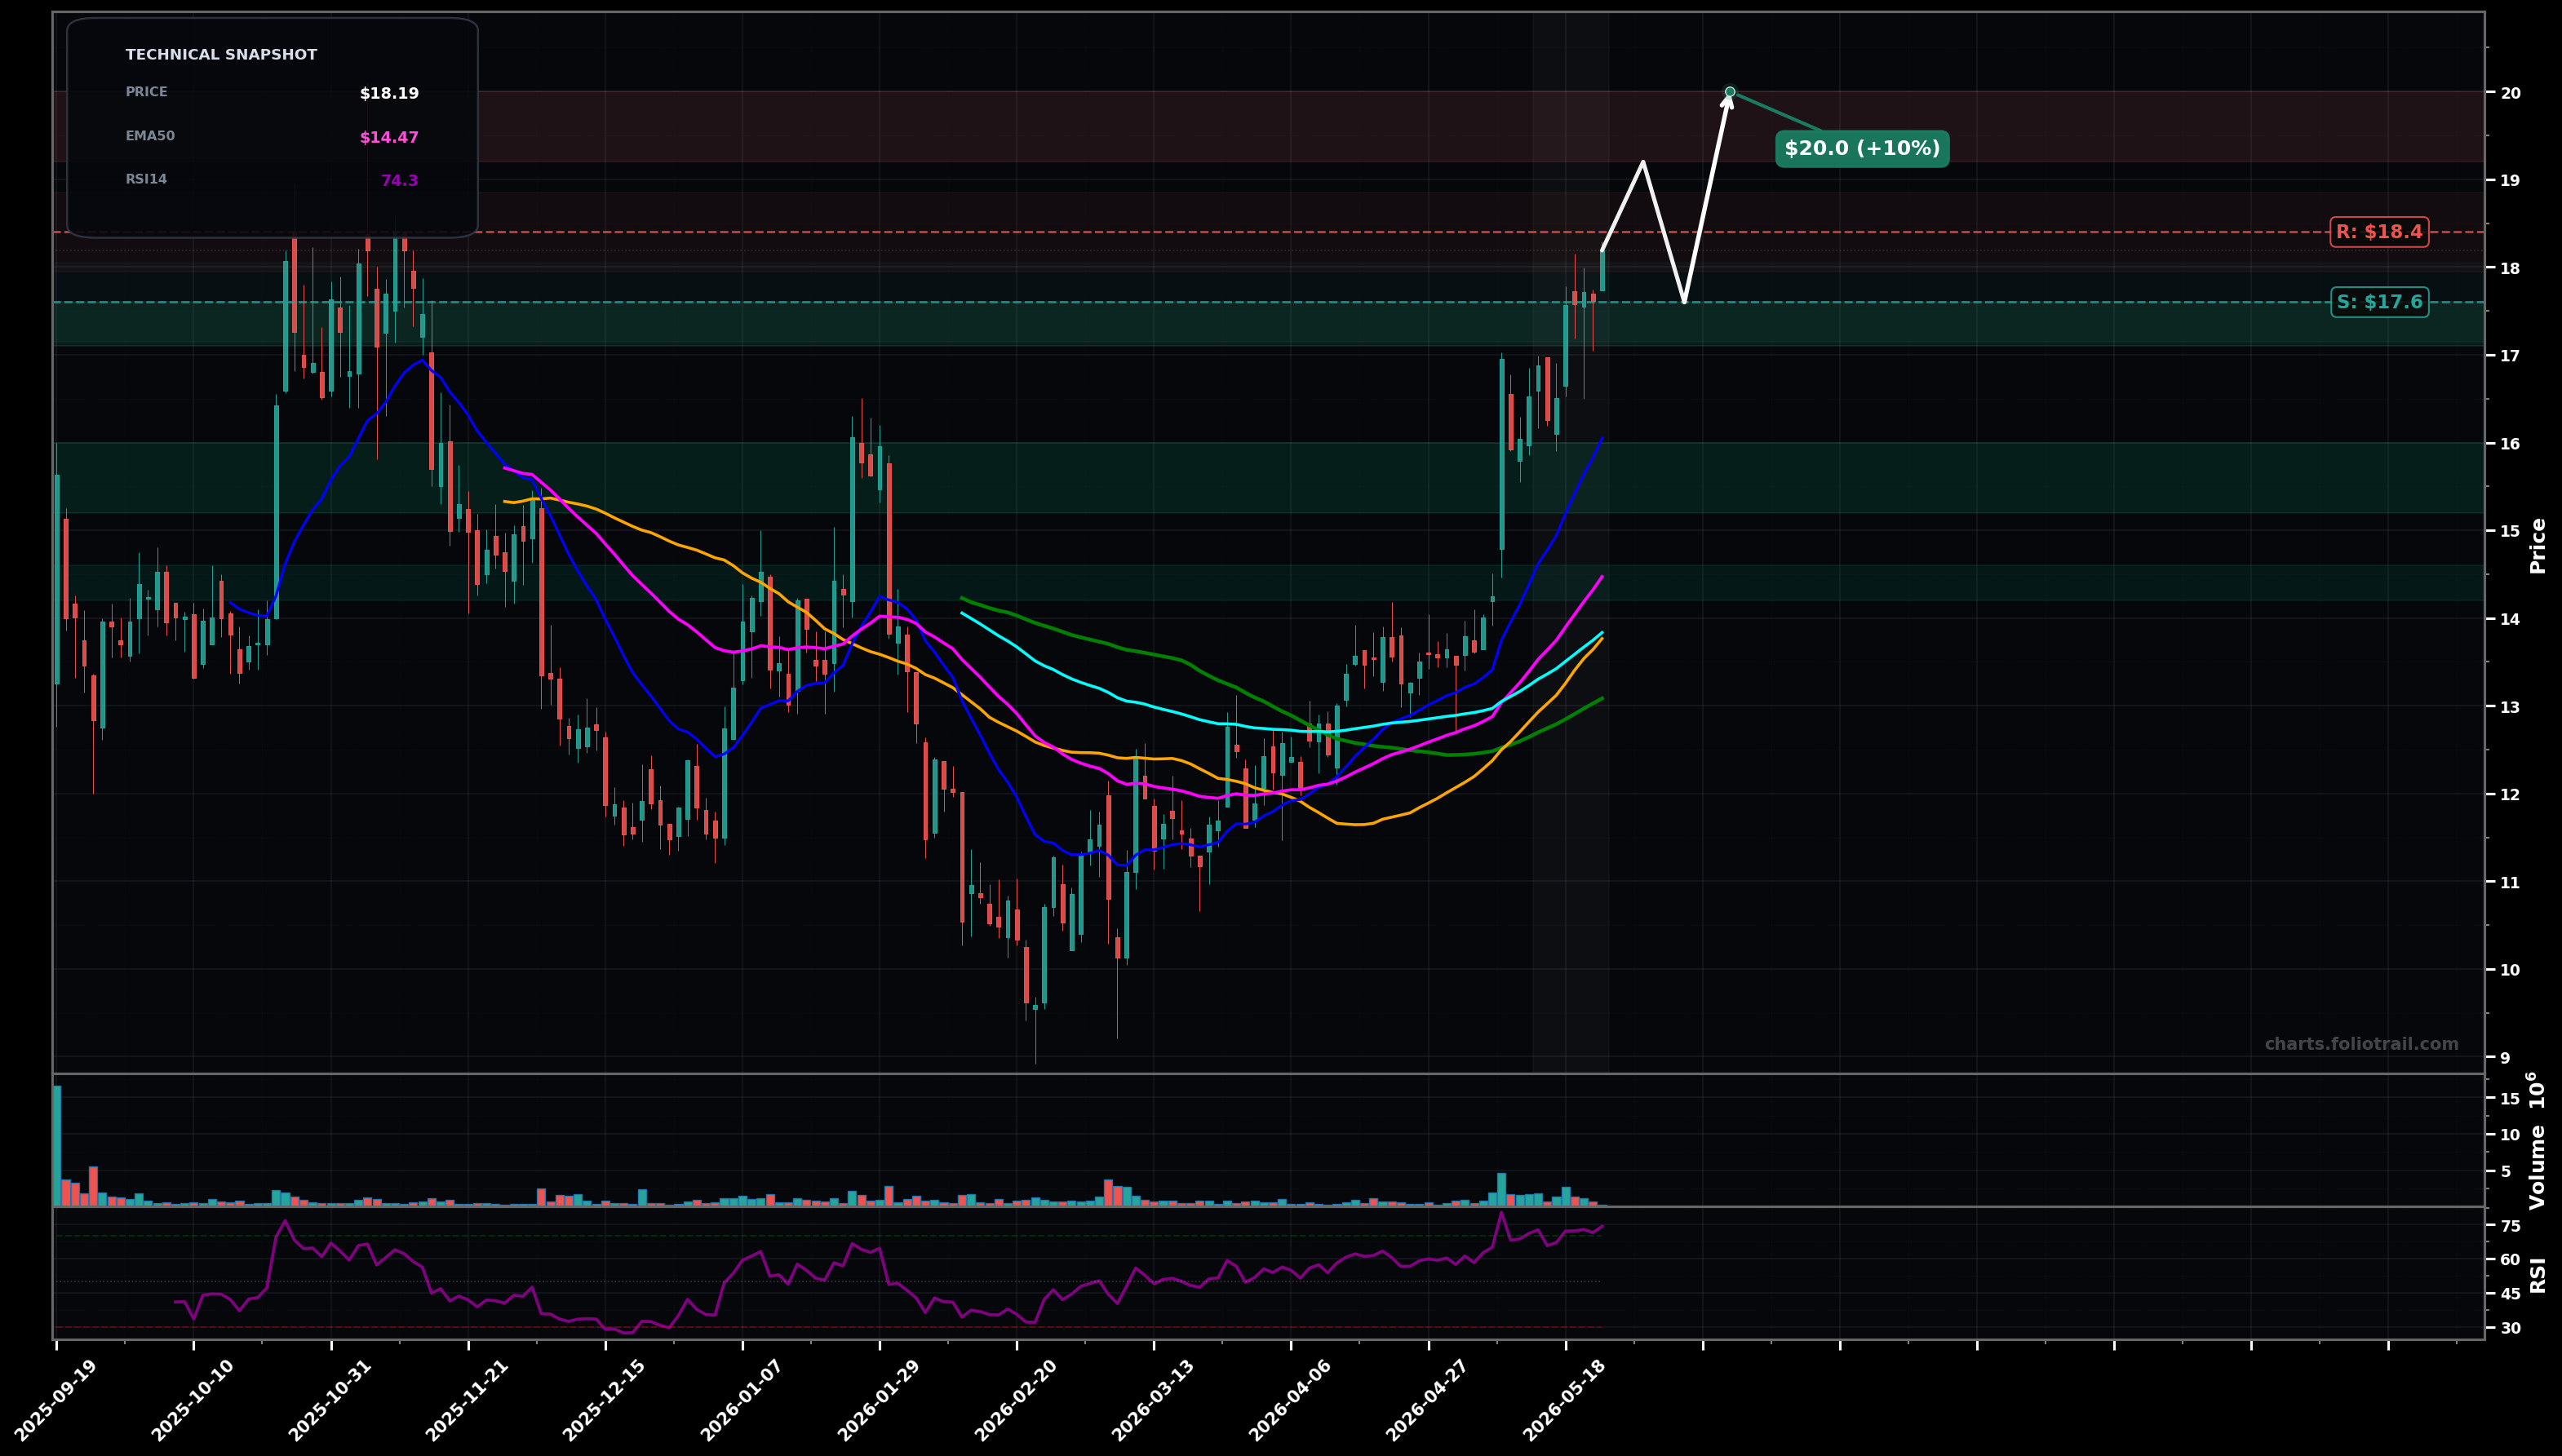
As of May 22, 2026, PTRN (Pattern Group Inc.) is in a uptrend state on the daily chart, with a confidence level of 74%. Key support is at $17.6 and key resistance at $18.4. Strong HH/HL advance; price at ~$18.19 extended above rising EMA50/EMA100 with RSI ~$74 (near overbought), suggesting momentum but pullback risk.
Bullish continuation: brief consolidation/pullback into the $17.6-$17.0 area, then breakout to new highs as the uptrend grinds higher (likely Wave 3/5 continuation; current push may be an extended Wave 3 with a Wave 4 pause).
Bearish mean-reversion: overbought conditions (RSI>70) trigger a deeper pullback to retest rising MAs; price revisits the confluence zone near EMA50/EMA100 and prior base before attempting to resume uptrend (Wave 4-type correction).
Hold above $17.60 on 2+ daily closes (prior breakout area) while EMA50 continues rising
Daily close below $14.40 (lost EMA50 + prior breakout structure)
Buy-the-dip levels are anchored to the breakout retest (~$17.6), then a deeper pullback into prior structure/round-number support (~$15s), with heavy add at EMA50 confluence/prior pivot zone (~$14.5).
Trim into upside extensions: first at next psychological/overhead supply ($19-$20), more on a likely Fibonacci extension zone ($21.5-$23), and fully close if price reaches a multi-year stretch/extension ($25-$28).
As of May 22, 2026, PTRN (Pattern Group Inc.) is in a uptrend state on the daily chart with 74% confidence. Strong HH/HL advance; price at ~$18.19 extended above rising EMA50/EMA100 with RSI ~$74 (near overbought), suggesting momentum but pullback risk.
On the daily timeframe, PTRN has key support at $17.6 and key resistance at $18.4. The most likely scenario (bullish) targets $19.2 and $20.0, with a revert level at $17.6.
PTRN (Pattern Group Inc.) is currently classified as uptrend on the daily chart, with 74% confidence. Confirmation requires: Hold above $17.60 on 2+ daily closes (prior breakout area) while EMA50 continues rising This would be invalidated by: Daily close below $14.40 (lost EMA50 + prior breakout structure)
The most likely scenario (bullish) targets $19.2 and $20.0, with a revert level at $17.6. The alternative scenario (bearish) targets $15.2 and $14.5.
Multi-layer AI agents analyse 200+ stocks across daily, weekly, and monthly timeframes — producing market state classifications, price scenarios with targets, and position entry/exit levels. Daily charts updated every trading day at 6 PM ET. Weekly charts refresh Fridays. Monthly charts refresh on the last trading day of each month. No paywall. No sign-up required.
Built by Foliotrail.
All content on this website — including charts, analysis, price targets, support/resistance levels, and position zones — is generated entirely by AI and provided for educational and informational purposes only.
This is not financial advice. NEXUSNOIR VENTURES SL (the operator of this website) is not a registered investment adviser or broker-dealer. You should not make investment decisions based solely on this information. Always do your own research and consult a qualified financial advisor.
By continuing, you acknowledge that you have read and agree to our full disclaimer & terms of use and privacy policy.