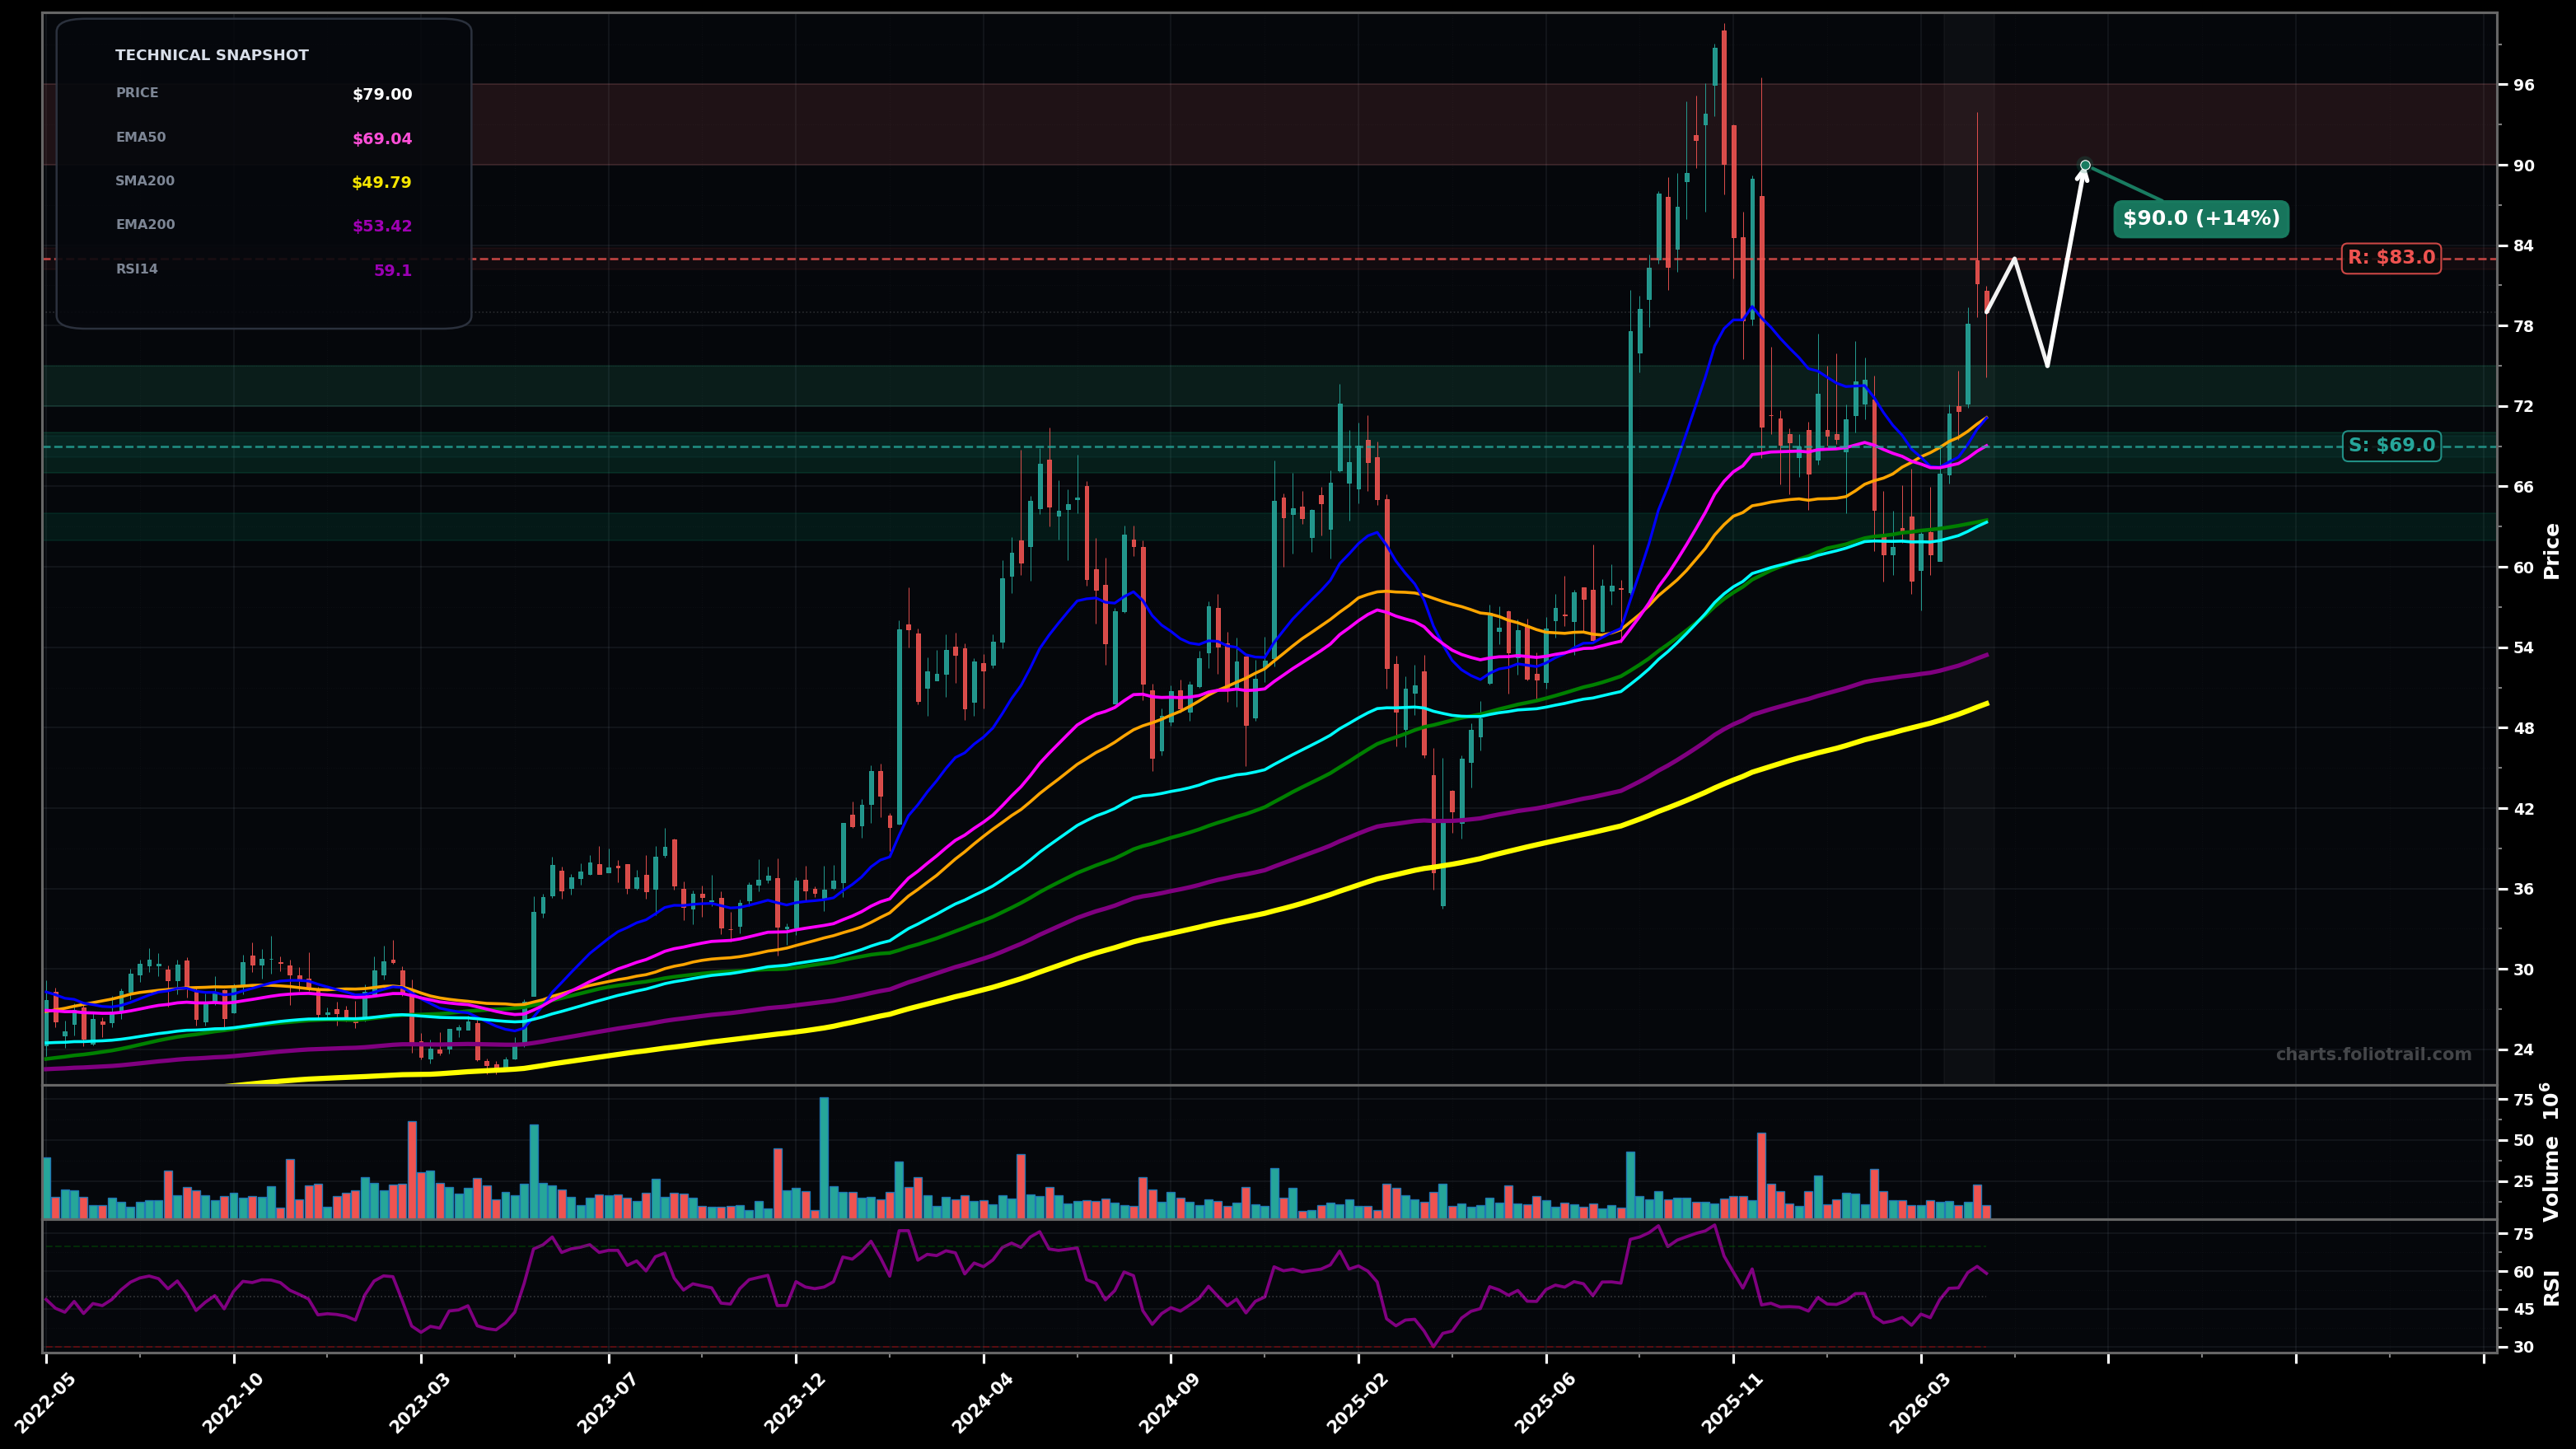
As of May 22, 2026, PSTG (Pure Storage Inc.) is in a uptrend state on the weekly chart, with a confidence level of 68%. Key support is at $69.0 and key resistance at $83.0. Weekly uptrend intact; sharp pullback from ~$99 peak, then rebound to $79 now holding above EMA50/EMA100 and above prior mid-range resistance (~$72-$75).
Bullish continuation: pullback stays shallow (above EMA50), then pushes through the $83 supply zone to retest the prior swing-high area; Elliott-wave view: this is likely a wave (4) completion and start of wave (5) toward new/near-new highs, with Fibonacci retest of the 38.2% area already largely absorbed.
Deeper correction / range: rejection at $83 leads to a larger ABC pullback into the confluence of EMA50 and prior breakout area; Fibonacci path: 50% retrace zone of the last impulse sits roughly in the low $70s with a potential 61.8% test nearer mid-$60s (EMA100).
Weekly close above $83 with follow-through holding above $79 the next week
Weekly close below $69 (loss of EMA50 support)
Scale in at prior breakout retest ($72-$75), add at EMA50 confluence (~$69), and heavy add near EMA100/swing-structure support (~$63) if the correction deepens without breaking the long-term base.
Trim into the prior blow-off/upper extension area ($90-$104) and consider full exit only on a strong wave-(5) style extension well above the prior highs (>$104), where probability of a multi-month mean reversion rises.
As of May 22, 2026, PSTG (Pure Storage Inc.) is in a uptrend state on the weekly chart with 68% confidence. Weekly uptrend intact; sharp pullback from ~$99 peak, then rebound to $79 now holding above EMA50/EMA100 and above prior mid-range resistance (~$72-$75).
On the weekly timeframe, PSTG has key support at $69.0 and key resistance at $83.0. The most likely scenario (bullish) targets $83.0 and $90.0, with a revert level at $75.0.
PSTG (Pure Storage Inc.) is currently classified as uptrend on the weekly chart, with 68% confidence. Confirmation requires: Weekly close above $83 with follow-through holding above $79 the next week This would be invalidated by: Weekly close below $69 (loss of EMA50 support)
The most likely scenario (bullish) targets $83.0 and $90.0, with a revert level at $75.0. The alternative scenario (bearish) targets $72.0 and $63.0.
Multi-layer AI agents analyse 200+ stocks across daily, weekly, and monthly timeframes — producing market state classifications, price scenarios with targets, and position entry/exit levels. Daily charts updated every trading day at 6 PM ET. Weekly charts refresh Fridays. Monthly charts refresh on the last trading day of each month. No paywall. No sign-up required.
Built by Foliotrail.
All content on this website — including charts, analysis, price targets, support/resistance levels, and position zones — is generated entirely by AI and provided for educational and informational purposes only.
This is not financial advice. NEXUSNOIR VENTURES SL (the operator of this website) is not a registered investment adviser or broker-dealer. You should not make investment decisions based solely on this information. Always do your own research and consult a qualified financial advisor.
By continuing, you acknowledge that you have read and agree to our full disclaimer & terms of use and privacy policy.