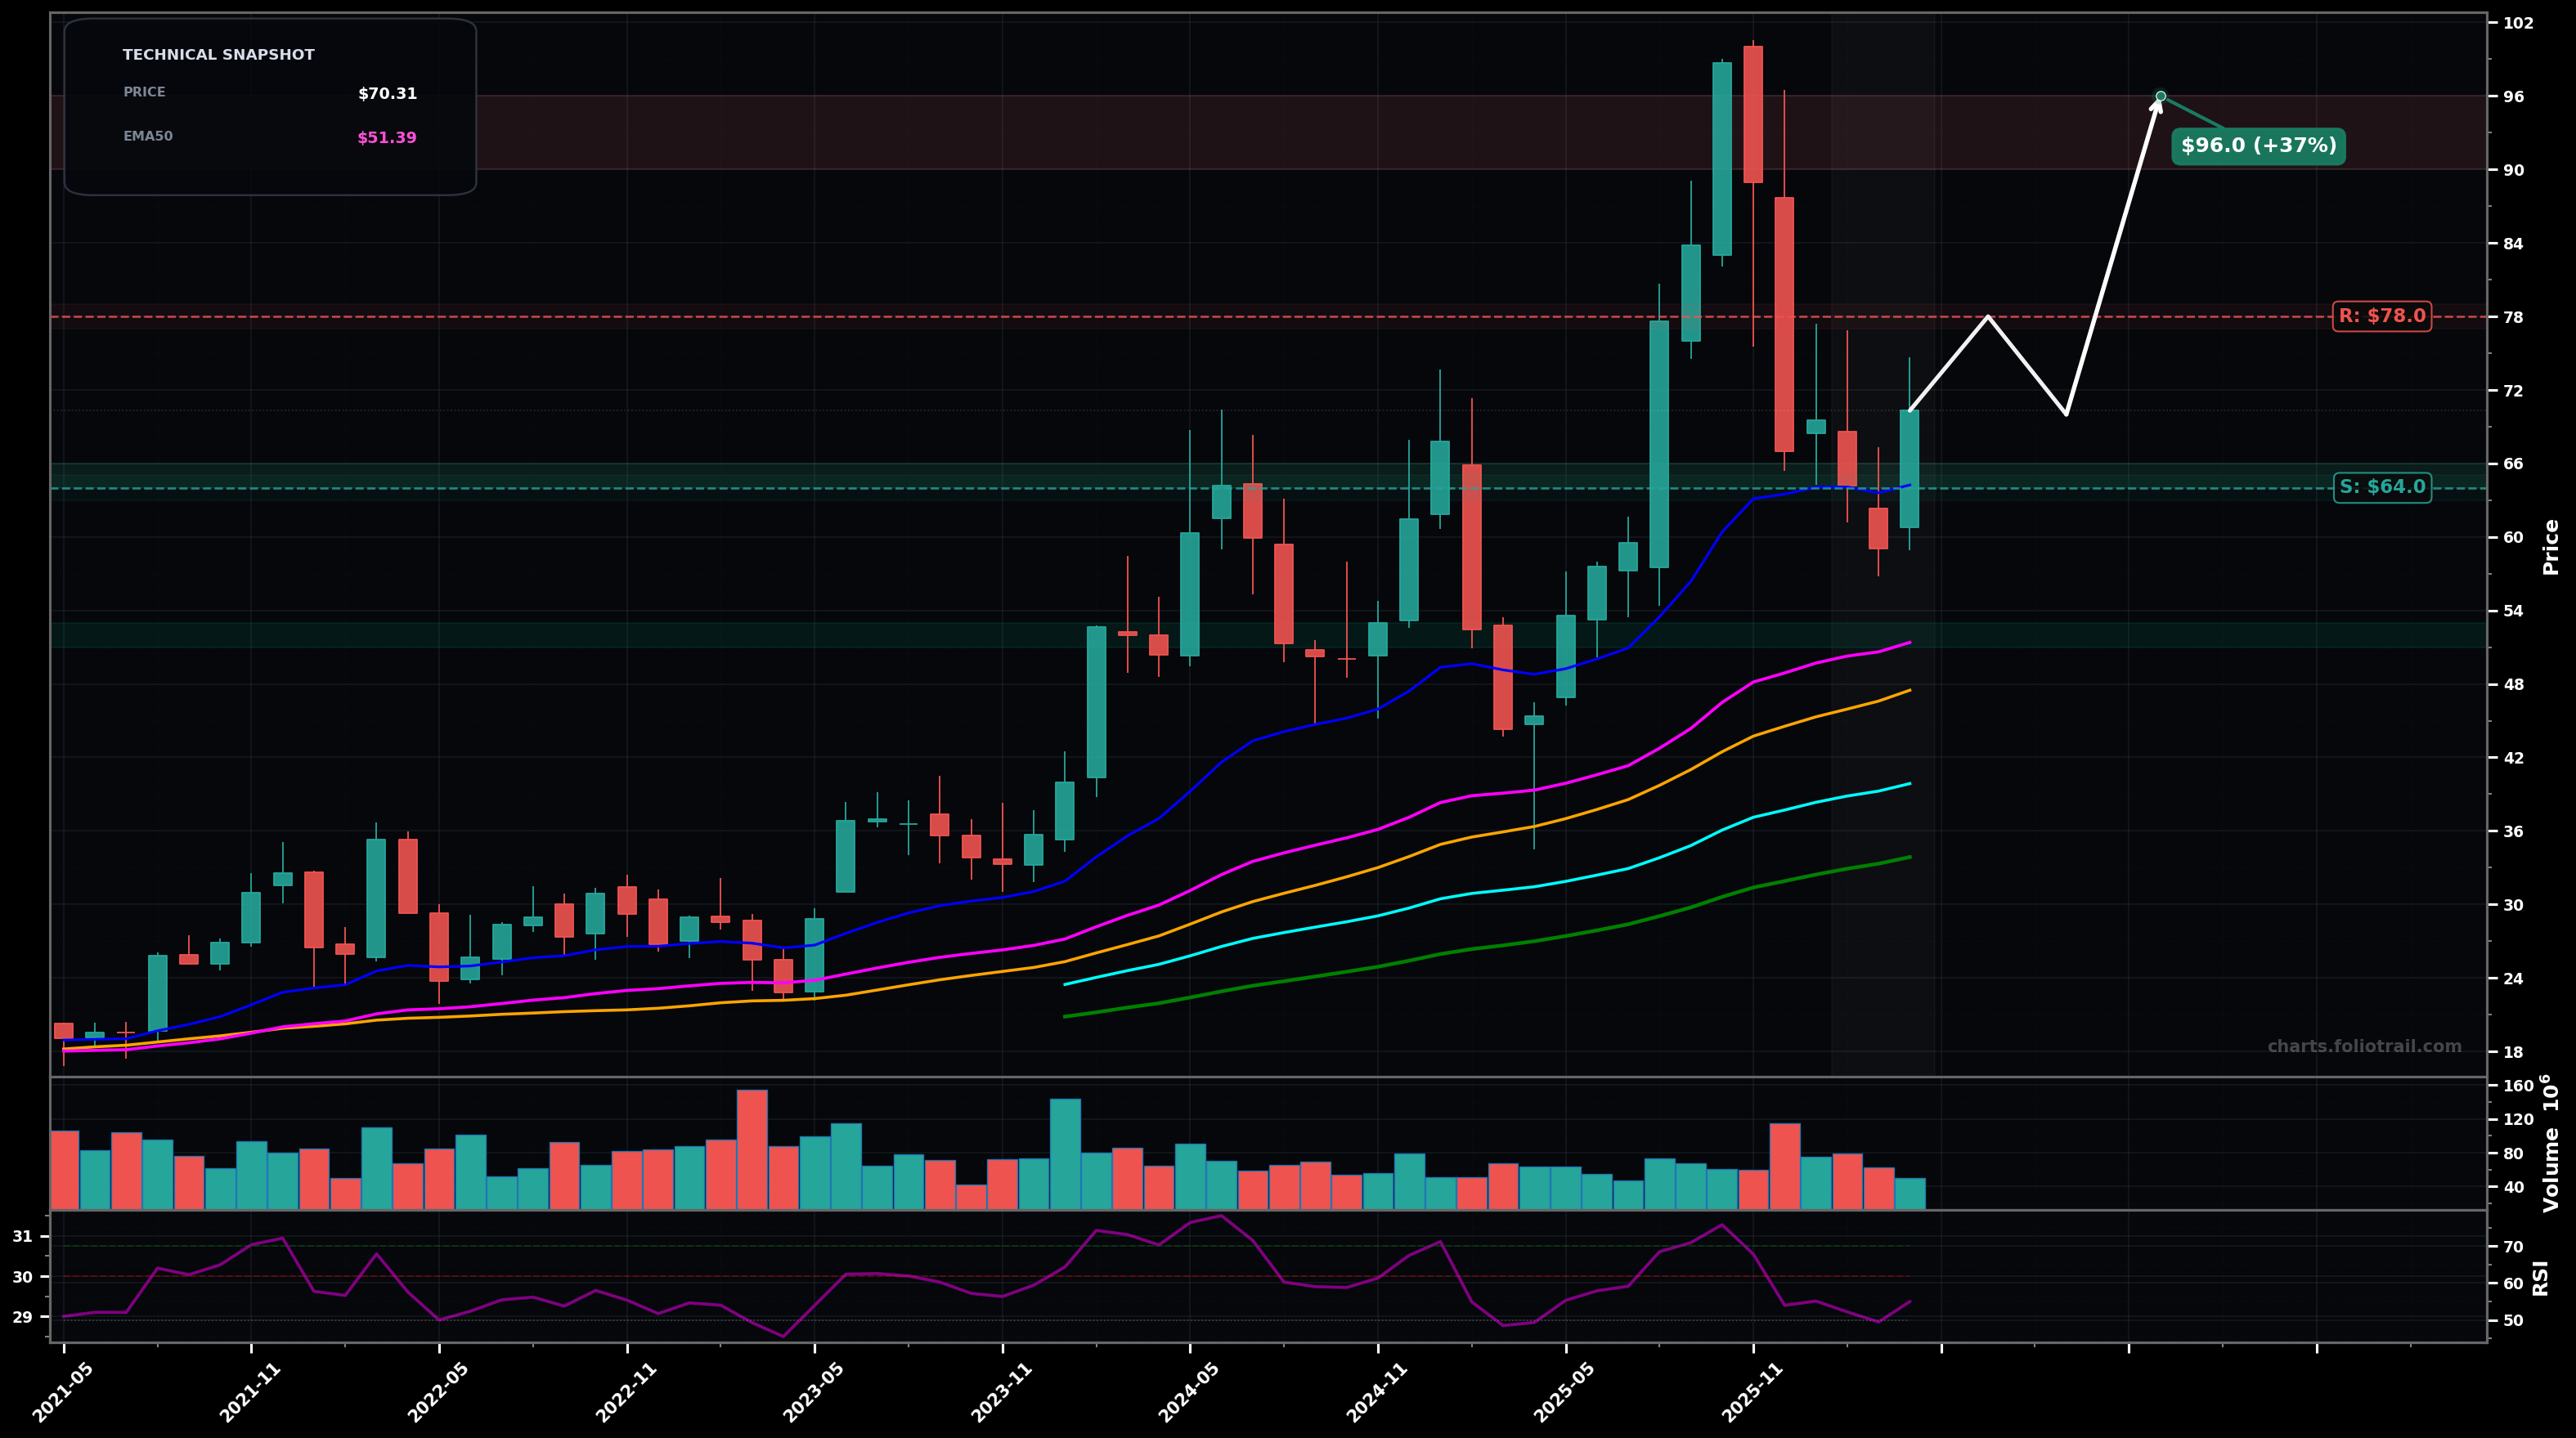
As of April 30, 2026, PSTG (Pure Storage Inc.) is in a volatility expansion state on the monthly chart, with a confidence level of 62%. Key support is at $64.0 and key resistance at $78.0. Monthly pullback from ~$96 peak into the ~$60s, then bounce to $70.31; price still above EMA50 (pink ~$51.39) and EMA100 (cyan ~$39.86) with RSI ~55.
Bullish continuation after a Wave-4-style correction: hold $64–$66, reclaim $78, then grind back toward the prior peak; Fibonacci-wise this looks like a pullback toward the 38.2%–50% zone of the ~$45→~$96 impulse, with buyers defending and trend MAs rising.
Bearish deeper correction: lose $64 support and slip toward the rising EMA50 area; this would fit an Elliott Wave extended Wave-4 or an ABC that drags price back to the 50%–61.8% retrace area and retests the moving-average cluster.
Two monthly closes above $78 would confirm the expansion resolves upward toward the prior highs.
A monthly close below $64 would invalidate the bullish resolution and favor a deeper corrective leg.
Start near the post-peak base/support ($64–$66), add on a flush to the next demand shelf (~$58–$60), heavy add at EMA50 confluence/major trend support (~$51–$53).
Trim into prior ATH supply ($90–$96), trim more if price extends into a likely Wave-5/extension zone ($102–$110), close if a multi-year overshoot/mania move develops well above prior highs ($120+).
As of April 30, 2026, PSTG (Pure Storage Inc.) is in a volatility expansion state on the monthly chart with 62% confidence. Monthly pullback from ~$96 peak into the ~$60s, then bounce to $70.31; price still above EMA50 (pink ~$51.39) and EMA100 (cyan ~$39.86) with RSI ~55.
On the monthly timeframe, PSTG has key support at $64.0 and key resistance at $78.0. The most likely scenario (bullish) targets $78.0 and $96.0, with a revert level at $70.0.
PSTG (Pure Storage Inc.) is currently classified as volatility expansion on the monthly chart, with 62% confidence. Confirmation requires: Two monthly closes above $78 would confirm the expansion resolves upward toward the prior highs. This would be invalidated by: A monthly close below $64 would invalidate the bullish resolution and favor a deeper corrective leg.
The most likely scenario (bullish) targets $78.0 and $96.0, with a revert level at $70.0. The alternative scenario (bearish) targets $58.0 and $52.0.
Multi-layer AI agents analyse 200+ stocks across daily, weekly, and monthly timeframes — producing market state classifications, price scenarios with targets, and position entry/exit levels. Daily charts updated every trading day at 6 PM ET. Weekly charts refresh Fridays. Monthly charts refresh on the last trading day of each month. No paywall. No sign-up required.
Built by Foliotrail.
All content on this website — including charts, analysis, price targets, support/resistance levels, and position zones — is generated entirely by AI and provided for educational and informational purposes only.
This is not financial advice. NEXUSNOIR VENTURES SL (the operator of this website) is not a registered investment adviser or broker-dealer. You should not make investment decisions based solely on this information. Always do your own research and consult a qualified financial advisor.
By continuing, you acknowledge that you have read and agree to our full disclaimer & terms of use and privacy policy.