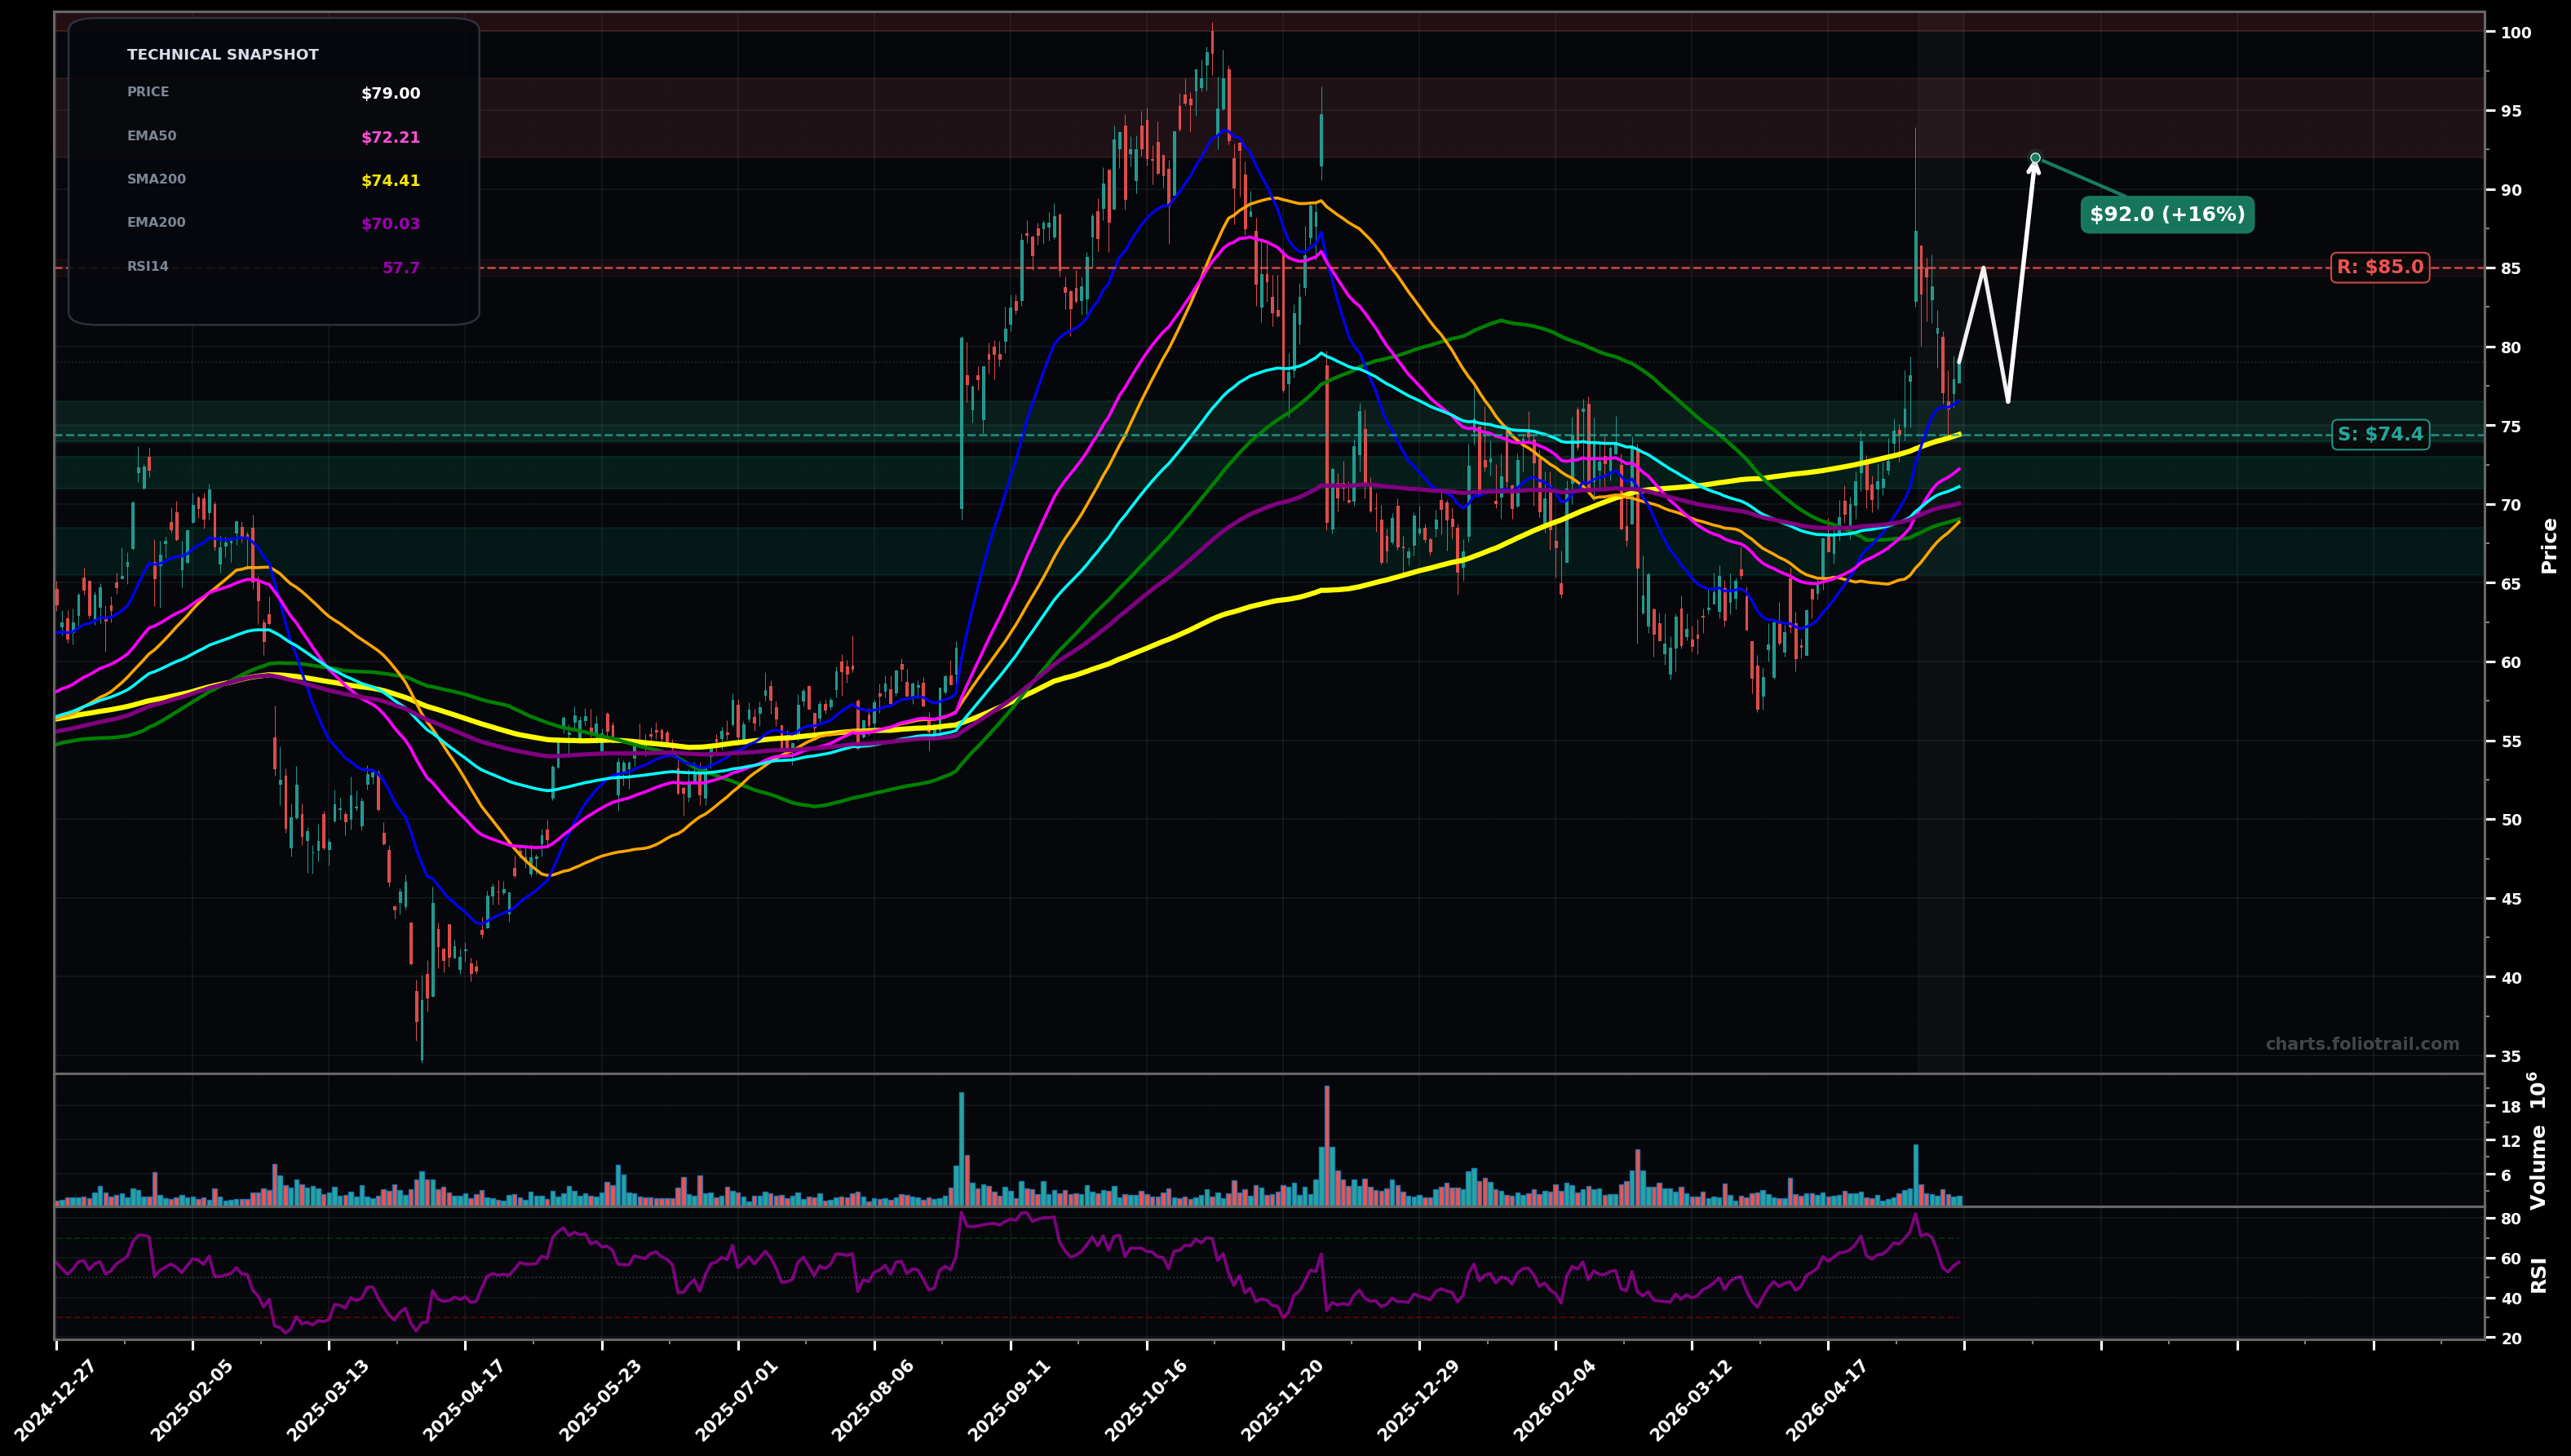
As of May 22, 2026, PSTG (Pure Storage Inc.) is in a volatility expansion state on the daily chart, with a confidence level of 67%. Key support is at $74.4 and key resistance at $85.0. Price at $79 after sharp run-up from the $60s; holding above all key MAs but pulling back from a ~$90 spike; RSI ~58 (cooling, not oversold).
Bullish consolidation/flag: price chops above the rising long-term MAs (SMA200 ~$74.41) and reclaims the post-spike supply zone, resuming the impulse leg. Elliott/Fib read: prior rally looks like an impulse (wave 1), pullback is a wave 2/4-style digestion; upside extension targets align with prior swing supply.
Bearish mean-reversion: failure to reclaim $85 leads to a deeper pullback into the MA cluster; loss of $74-$72 risks a larger ABC retrace toward the prior base. Elliott/Fib read: current move becomes a corrective ABC with C targeting the prior breakout area.
VOLATILITY_EXPANSION confirmed if a daily close > $85 holds for 2+ closes (follow-through above prior supply).
VOLATILITY_EXPANSION shifts bearish if a daily close < $72 (loss of EMA50/cluster support) holds for 2+ closes.
Start near SMA200/$74 pivot support; add on EMA100/EMA50 loss test ($71-$73); heavy add only if larger ABC retrace hits prior base/MA shelf ($66-$69).
Trim into prior high/extension zones after volatility expansion (likely Fib extensions above the ~$60-$90 impulse); progressively de-risk as price becomes increasingly stretched above the MA stack.
As of May 22, 2026, PSTG (Pure Storage Inc.) is in a volatility expansion state on the daily chart with 67% confidence. Price at $79 after sharp run-up from the $60s; holding above all key MAs but pulling back from a ~$90 spike; RSI ~58 (cooling, not oversold).
On the daily timeframe, PSTG has key support at $74.4 and key resistance at $85.0. The most likely scenario (bullish) targets $85.0 and $92.0, with a revert level at $76.5.
PSTG (Pure Storage Inc.) is currently classified as volatility expansion on the daily chart, with 67% confidence. Confirmation requires: VOLATILITY_EXPANSION confirmed if a daily close > $85 holds for 2+ closes (follow-through above prior supply). This would be invalidated by: VOLATILITY_EXPANSION shifts bearish if a daily close < $72 (loss of EMA50/cluster support) holds for 2+ closes.
The most likely scenario (bullish) targets $85.0 and $92.0, with a revert level at $76.5. The alternative scenario (bearish) targets $72.0 and $66.0.
Multi-layer AI agents analyse 200+ stocks across daily, weekly, and monthly timeframes — producing market state classifications, price scenarios with targets, and position entry/exit levels. Daily charts updated every trading day at 6 PM ET. Weekly charts refresh Fridays. Monthly charts refresh on the last trading day of each month. No paywall. No sign-up required.
Built by Foliotrail.
All content on this website — including charts, analysis, price targets, support/resistance levels, and position zones — is generated entirely by AI and provided for educational and informational purposes only.
This is not financial advice. NEXUSNOIR VENTURES SL (the operator of this website) is not a registered investment adviser or broker-dealer. You should not make investment decisions based solely on this information. Always do your own research and consult a qualified financial advisor.
By continuing, you acknowledge that you have read and agree to our full disclaimer & terms of use and privacy policy.