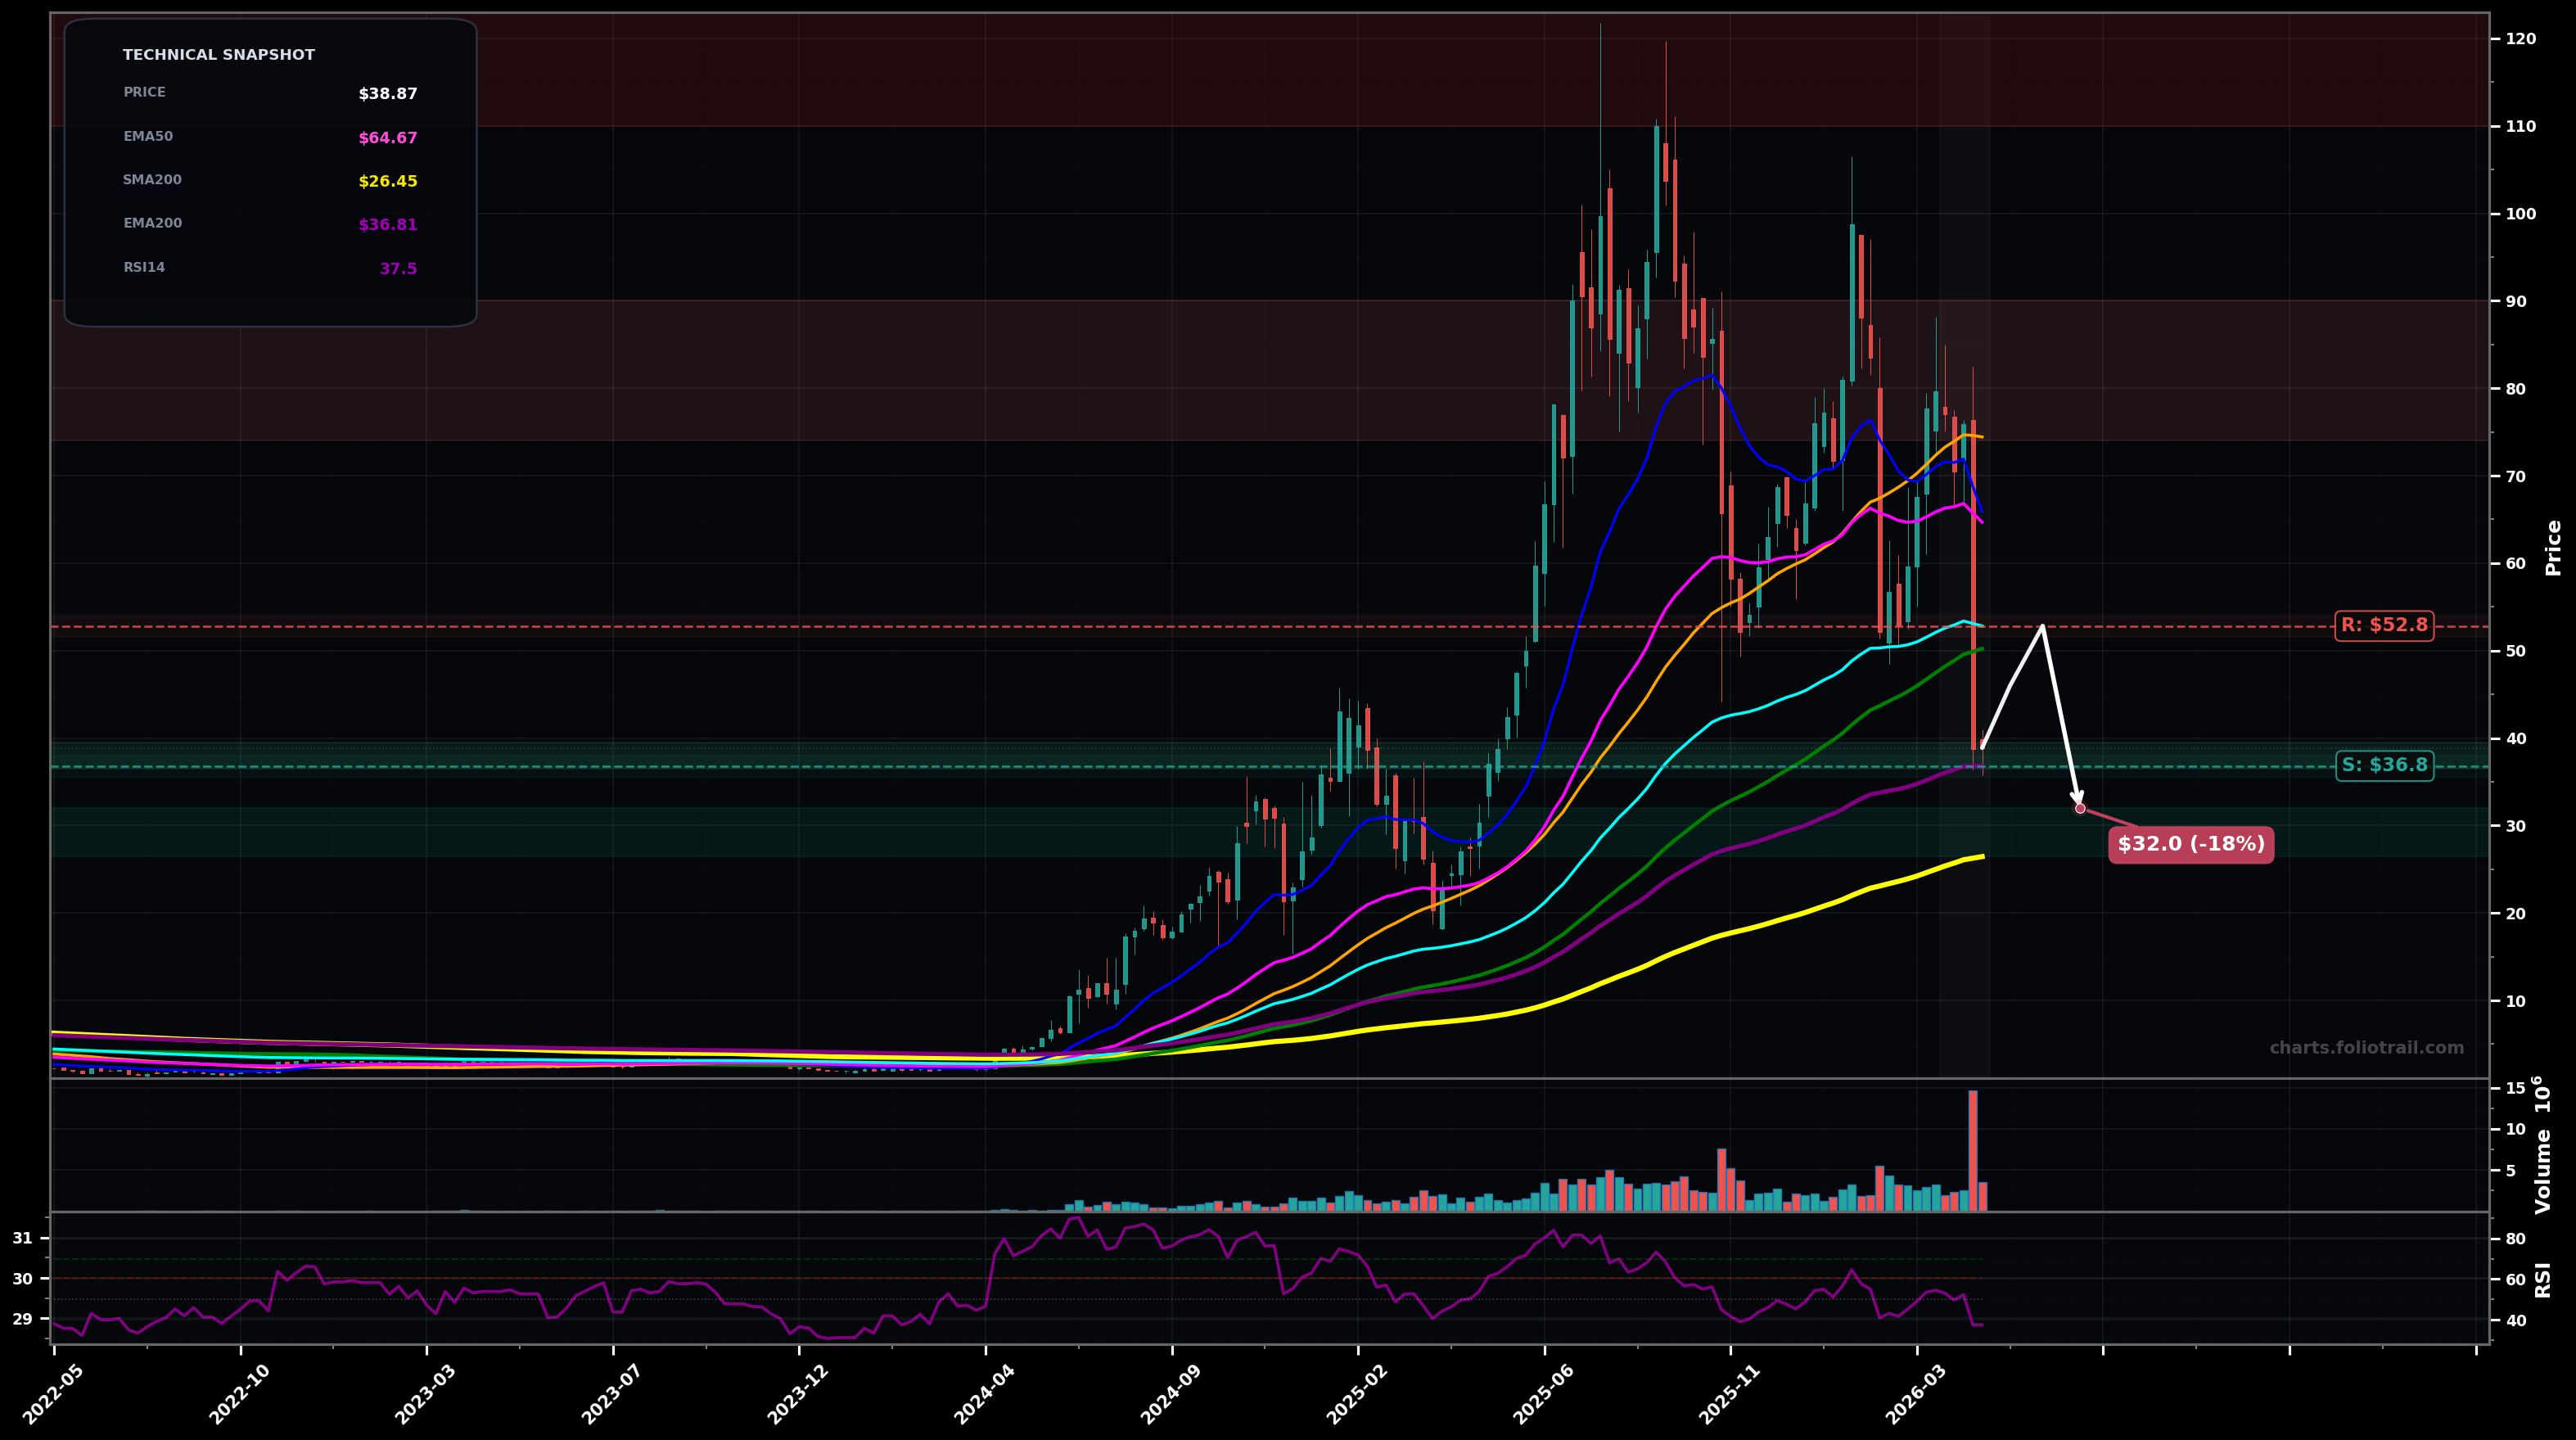
As of May 22, 2026, PSIX (Power Solutions International, Inc.) is in a falling knife state on the weekly chart, with a confidence level of 74%. Key support is at $36.8 and key resistance at $52.8. Weekly PSIX sold off hard to ~$38.87 on a high-volume dump, breaking below EMA200 (~$36.81) area intrabar and far below EMA50/100 (~$64.67/$52.81); RSI14 ~37 (weak momentum).
Dead-cat bounce / relief rally from the EMA200 zone, then rejection at prior breakdown levels (EMA100/structure) and another leg down to test deeper supports (Fibo retrace of the 2024–2025 impulse). Prob ~60%.
Capitulation low forms near $36–$32 followed by a base and a breakout-reversal attempt (reclaim EMA100), implying a larger Elliott corrective pattern completion (Wave C ending) and start of a new impulsive advance. Prob ~40%.
Weekly close below $36.80 (EMA200) with follow-through toward $32.00
Weekly close back above $52.80 (EMA100) and hold for 2+ weeks
Start near EMA200/pivot support; add on breakdown-to-support (likely 50–61.8% retrace of the 2024–2025 run); heavy add only if a deeper capitulation tags the rising SMA200 (~$26.45) zone.
Trim into prior supply/failed swing zone and major MA confluence (SMA50 ~ $74) then more into the prior distribution top (~$90–$110); full exit if price re-enters/extends beyond the prior blow-off peak region.
As of May 22, 2026, PSIX (Power Solutions International, Inc.) is in a falling knife state on the weekly chart with 74% confidence. Weekly PSIX sold off hard to ~$38.87 on a high-volume dump, breaking below EMA200 (~$36.81) area intrabar and far below EMA50/100 (~$64.67/$52.81); RSI14 ~37 (weak momentum).
On the weekly timeframe, PSIX has key support at $36.8 and key resistance at $52.8. The most likely scenario (bearish) targets $46.0 and $32.0, with a revert level at $52.8.
PSIX (Power Solutions International, Inc.) is currently classified as falling knife on the weekly chart, with 74% confidence. Confirmation requires: Weekly close below $36.80 (EMA200) with follow-through toward $32.00 This would be invalidated by: Weekly close back above $52.80 (EMA100) and hold for 2+ weeks
The most likely scenario (bearish) targets $46.0 and $32.0, with a revert level at $52.8. The alternative scenario (bullish) targets $52.8 and $64.7.
Multi-layer AI agents analyse 200+ stocks across daily, weekly, and monthly timeframes — producing market state classifications, price scenarios with targets, and position entry/exit levels. Daily charts updated every trading day at 6 PM ET. Weekly charts refresh Fridays. Monthly charts refresh on the last trading day of each month. No paywall. No sign-up required.
Built by Foliotrail.
All content on this website — including charts, analysis, price targets, support/resistance levels, and position zones — is generated entirely by AI and provided for educational and informational purposes only.
This is not financial advice. NEXUSNOIR VENTURES SL (the operator of this website) is not a registered investment adviser or broker-dealer. You should not make investment decisions based solely on this information. Always do your own research and consult a qualified financial advisor.
By continuing, you acknowledge that you have read and agree to our full disclaimer & terms of use and privacy policy.