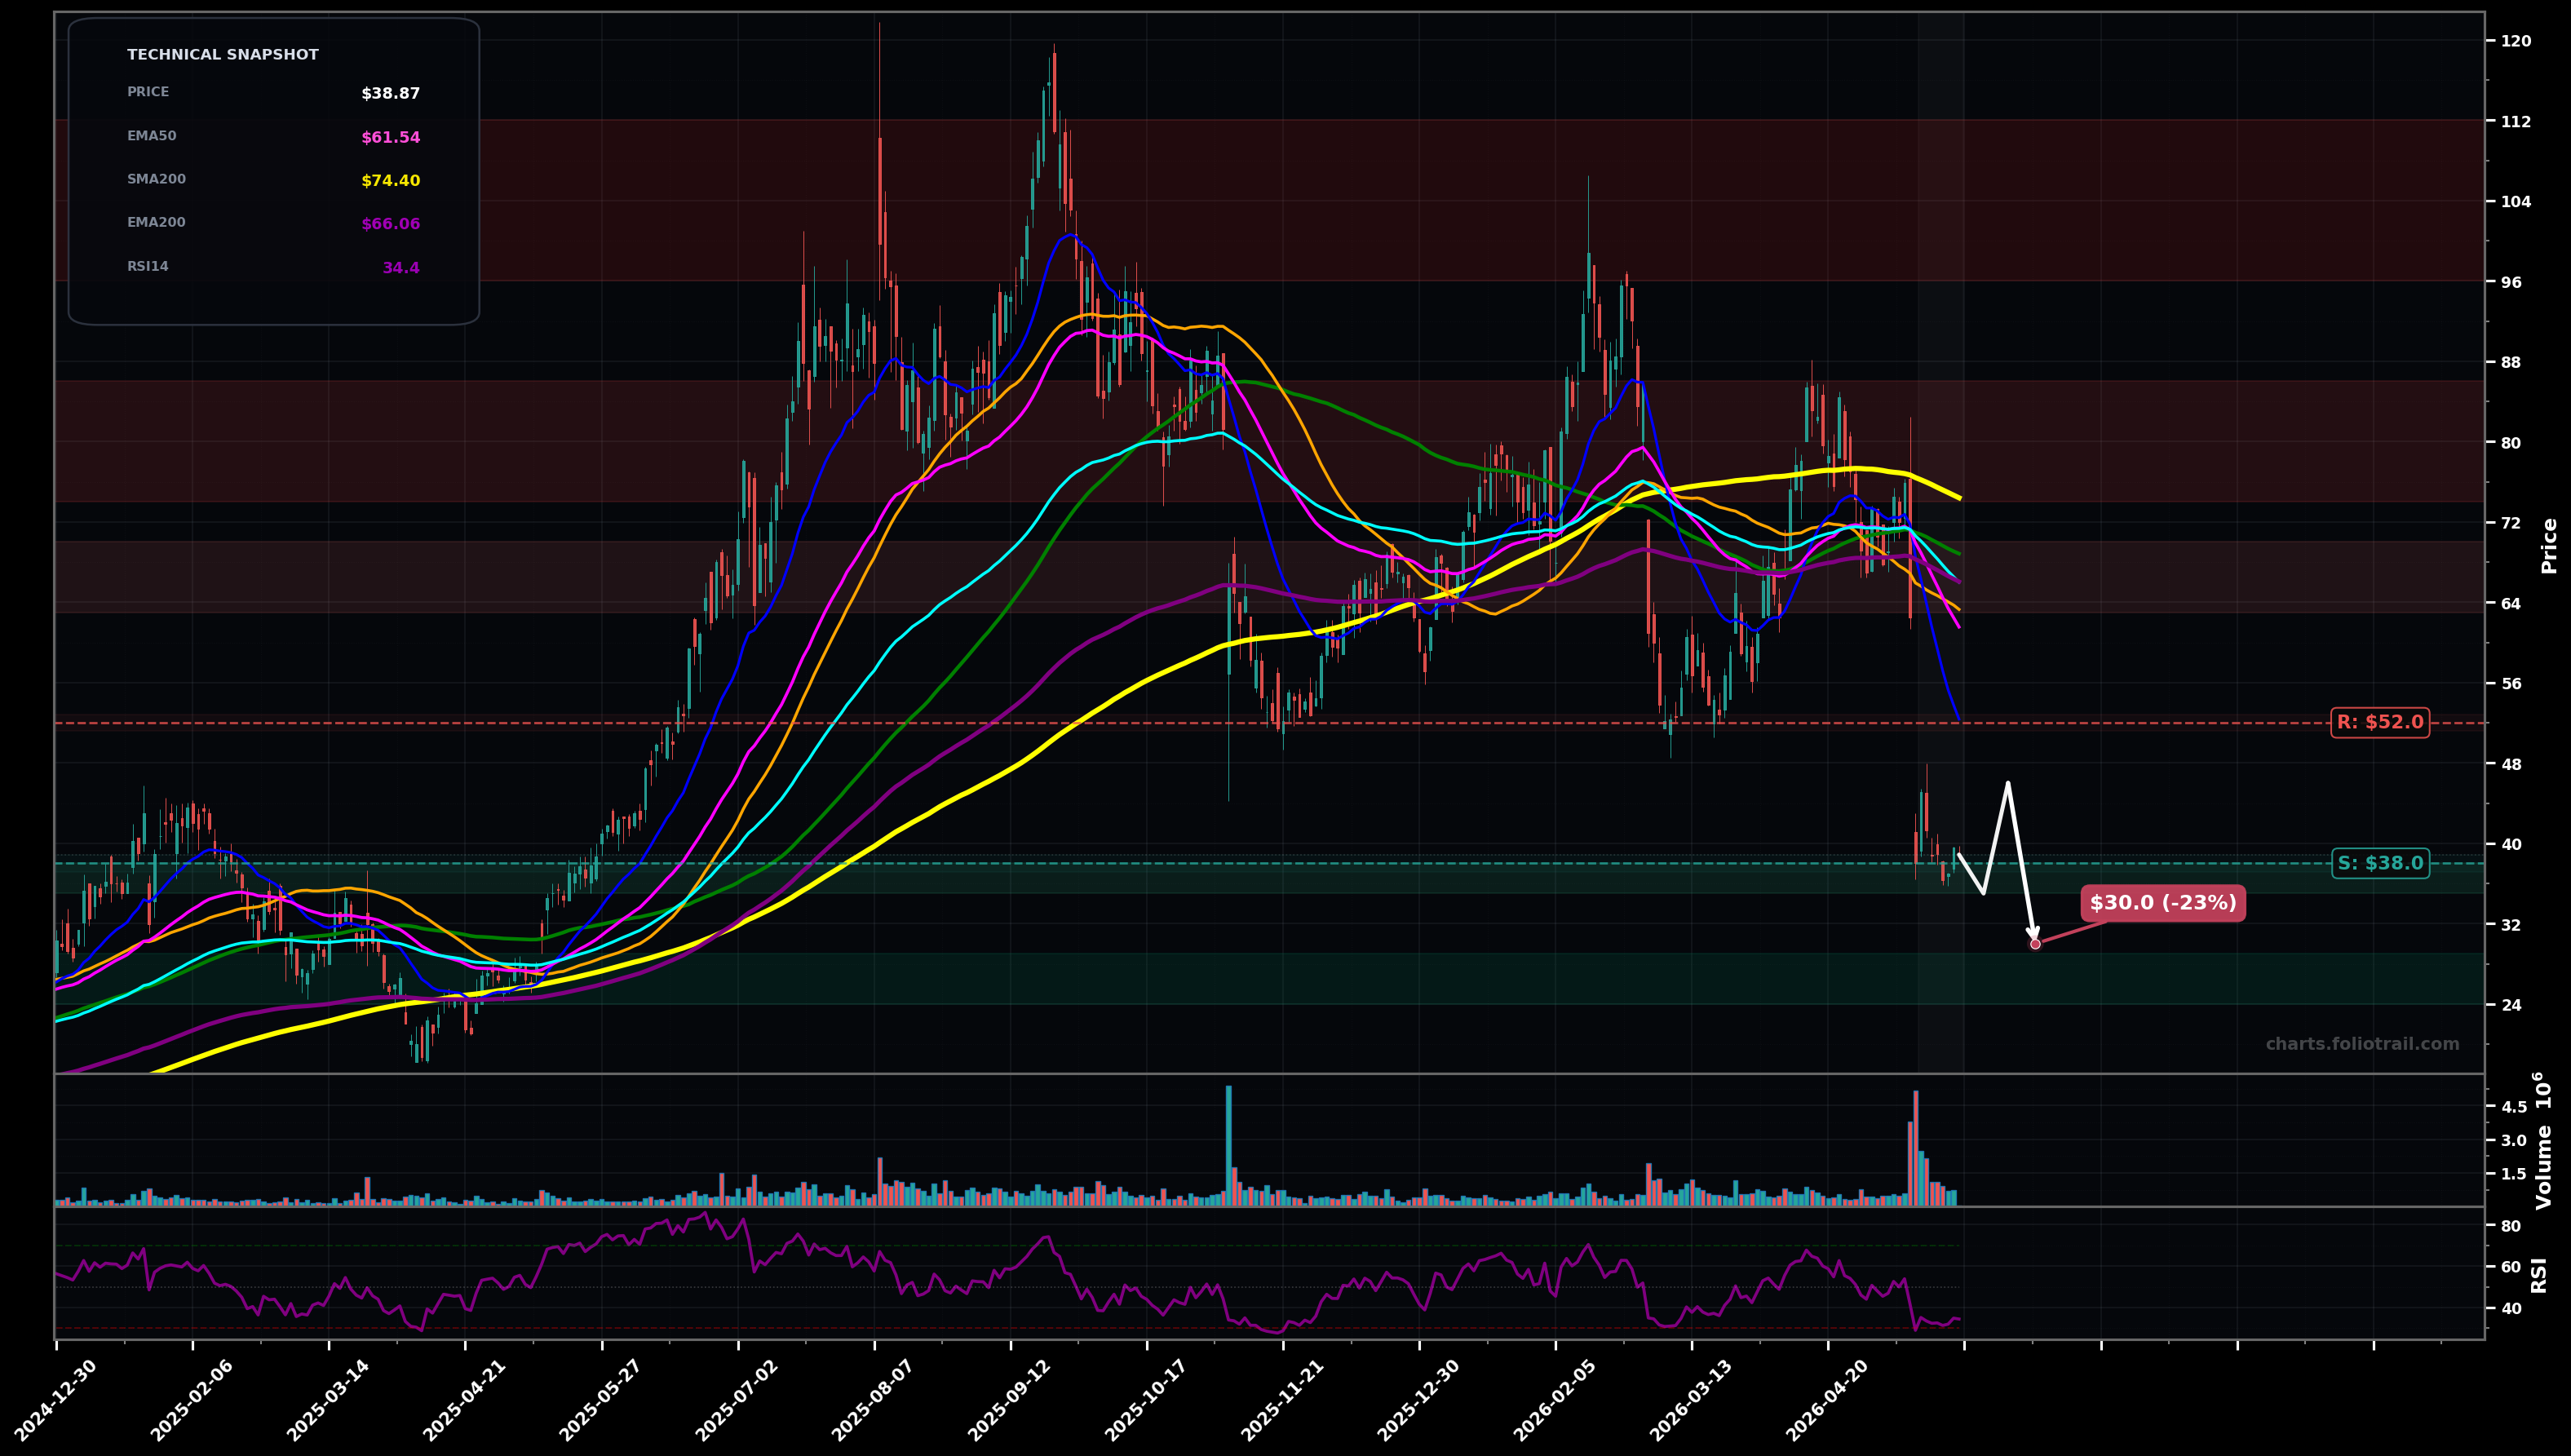
As of May 22, 2026, PSIX (Power Solutions International, Inc.) is in a falling knife state on the daily chart, with a confidence level of 82%. Key support is at $38.0 and key resistance at $52.0. Sharp breakdown to $38.87 with heavy volume, price far below all key MAs; RSI-14 ~34 (weak/near-oversold).
Bear flag / weak bounce then continuation lower; typical wave-3-like impulse may extend before a meaningful base forms.
Capitulation low forms near $35-$38 followed by an oversold mean-reversion rally (corrective Wave 4 / Wave A) toward the first MA cluster; rally likely sold into unless $52+ is reclaimed.
Daily close below $38.00
Daily close back above $52.00 (reclaim of the broken breakdown zone/near-term pivot)
Buy zones mapped to current swing-low area then lower Fib extension/round-number shelves; only scale if price stabilizes (fewer large red closes) or prints a HL/undercut-and-rally.
Trim into prior breakdown/MA clusters (EMA50/100/200 and SMA50/100/200 region) and prior swing-supply; full exit into old peak supply where prior impulse topped.
As of May 22, 2026, PSIX (Power Solutions International, Inc.) is in a falling knife state on the daily chart with 82% confidence. Sharp breakdown to $38.87 with heavy volume, price far below all key MAs; RSI-14 ~34 (weak/near-oversold).
On the daily timeframe, PSIX has key support at $38.0 and key resistance at $52.0. The most likely scenario (bearish) targets $35.0 and $30.0, with a revert level at $46.0.
PSIX (Power Solutions International, Inc.) is currently classified as falling knife on the daily chart, with 82% confidence. Confirmation requires: Daily close below $38.00 This would be invalidated by: Daily close back above $52.00 (reclaim of the broken breakdown zone/near-term pivot)
The most likely scenario (bearish) targets $35.0 and $30.0, with a revert level at $46.0. The alternative scenario (bullish) targets $46.0 and $55.0.
Multi-layer AI agents analyse 200+ stocks across daily, weekly, and monthly timeframes — producing market state classifications, price scenarios with targets, and position entry/exit levels. Daily charts updated every trading day at 6 PM ET. Weekly charts refresh Fridays. Monthly charts refresh on the last trading day of each month. No paywall. No sign-up required.
Built by Foliotrail.
All content on this website — including charts, analysis, price targets, support/resistance levels, and position zones — is generated entirely by AI and provided for educational and informational purposes only.
This is not financial advice. NEXUSNOIR VENTURES SL (the operator of this website) is not a registered investment adviser or broker-dealer. You should not make investment decisions based solely on this information. Always do your own research and consult a qualified financial advisor.
By continuing, you acknowledge that you have read and agree to our full disclaimer & terms of use and privacy policy.