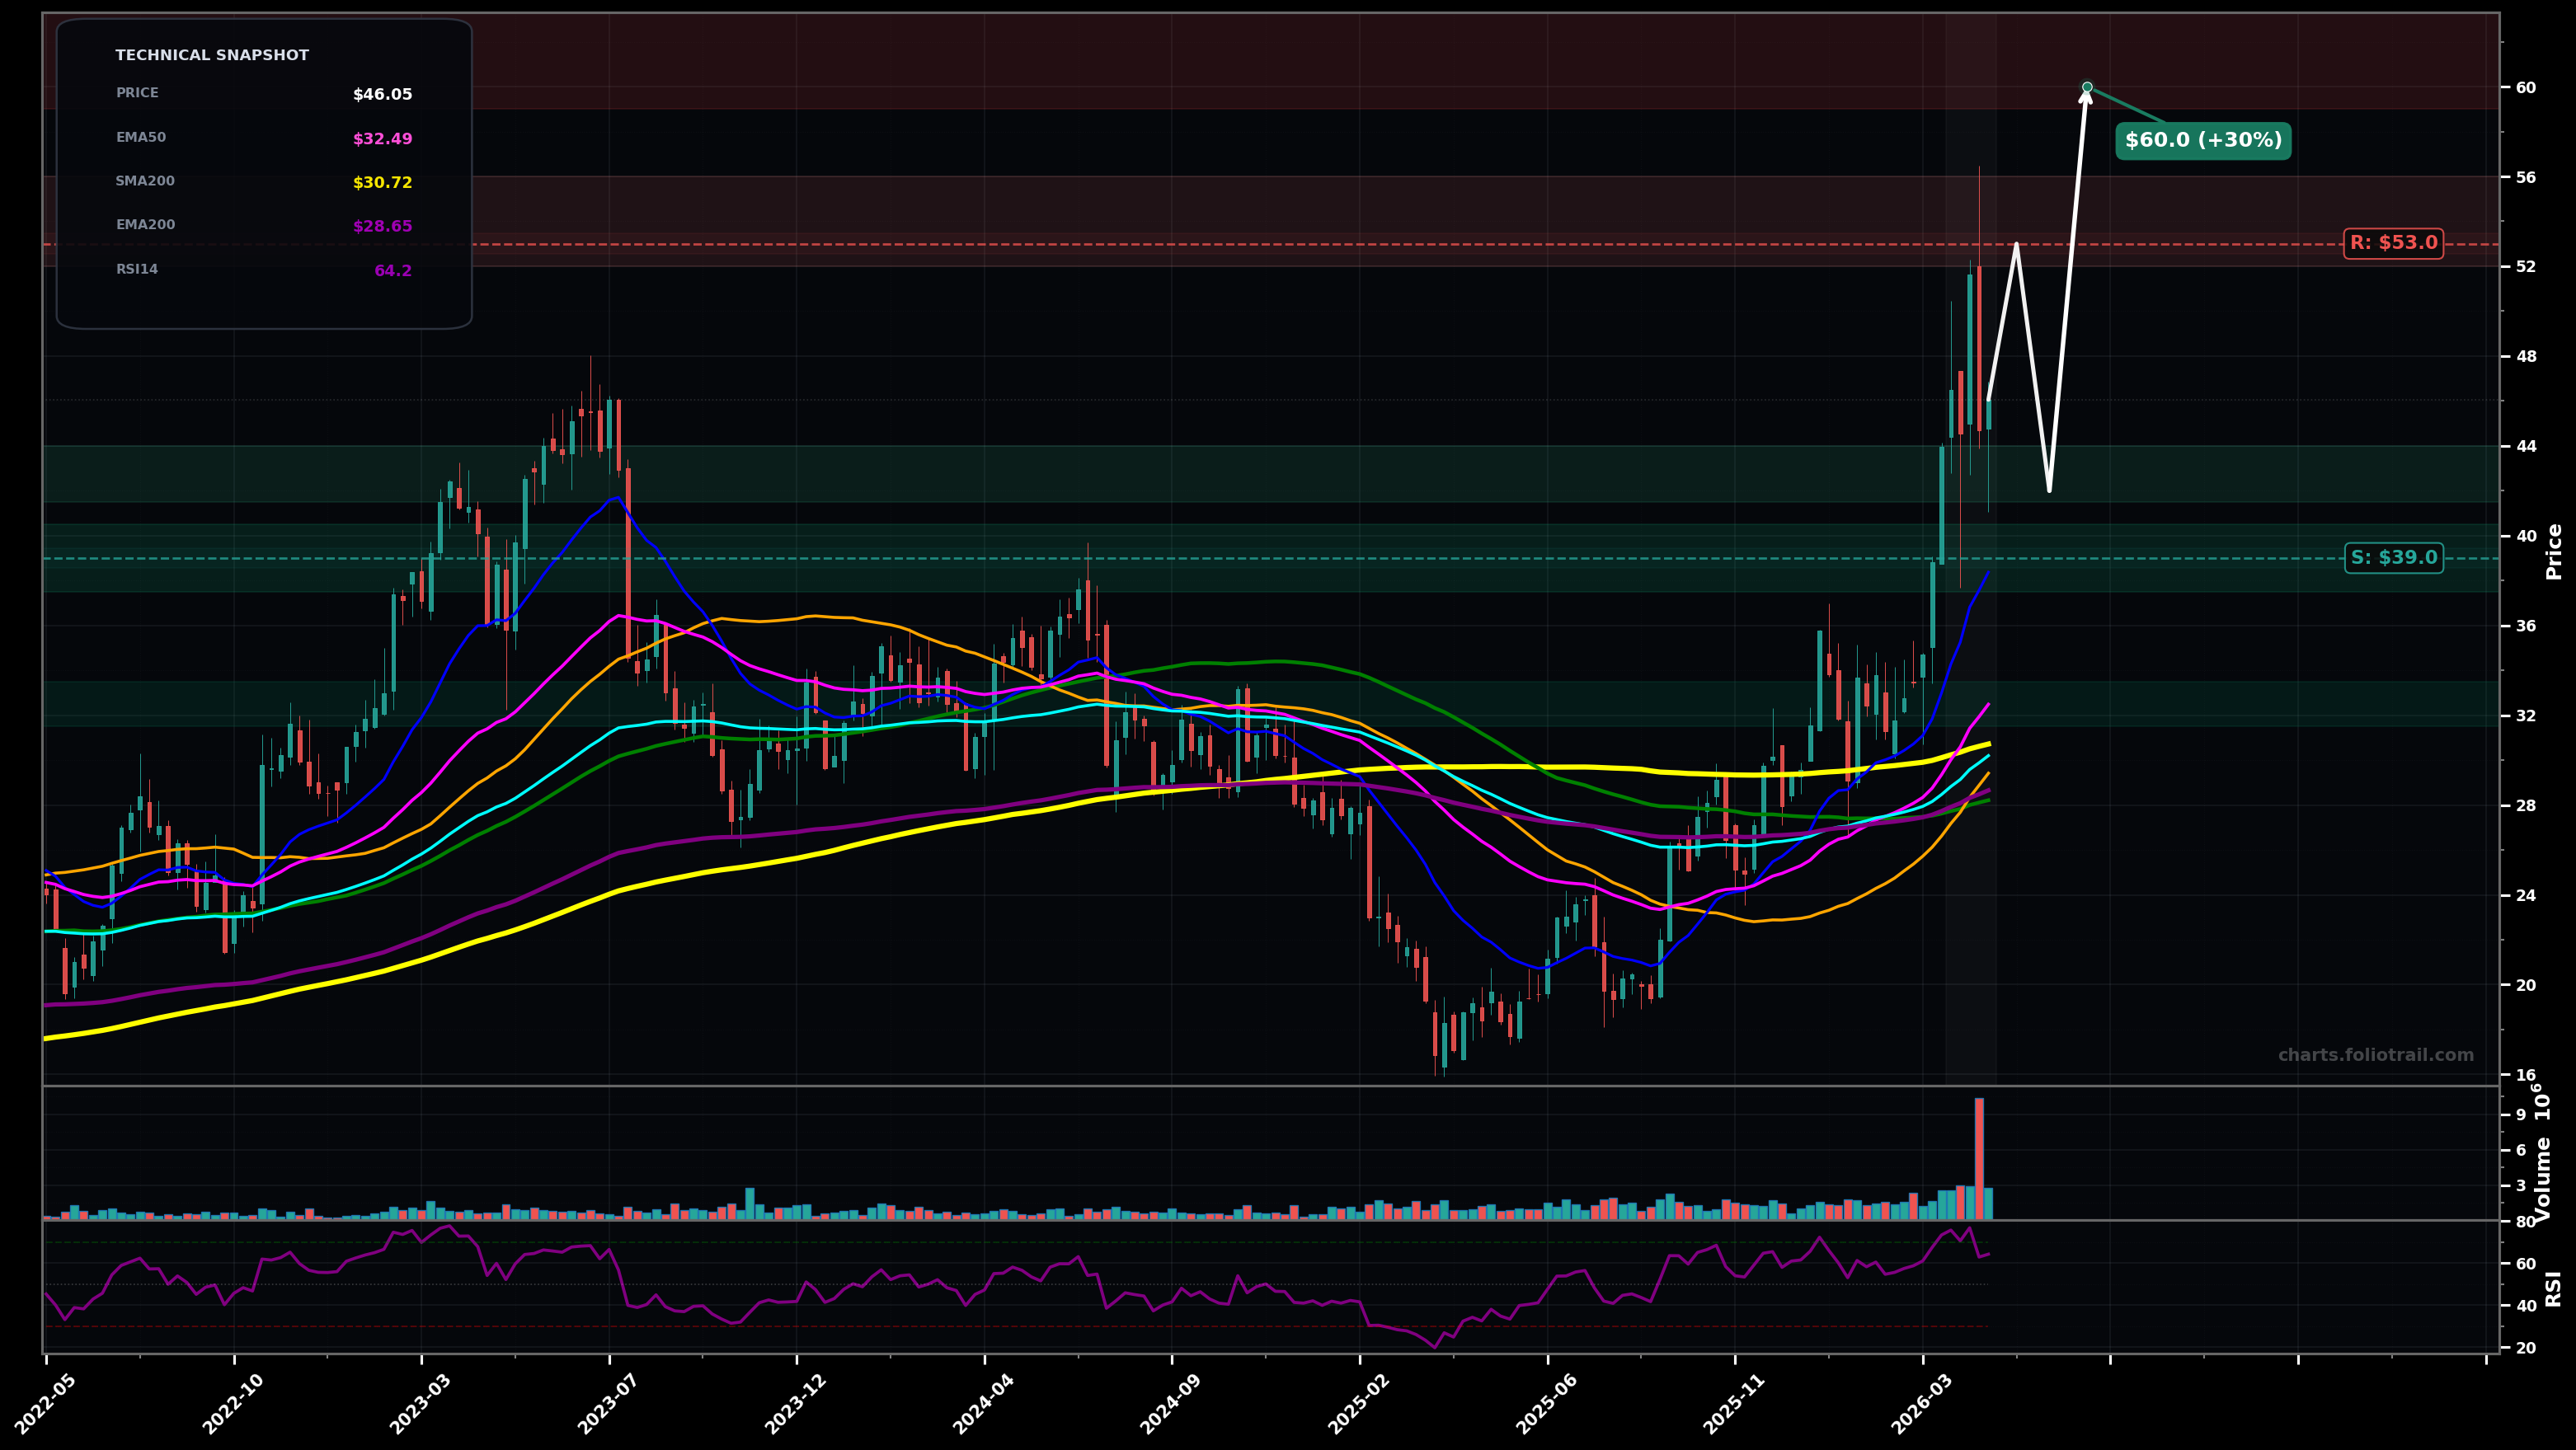
As of May 22, 2026, PDFS (Pdf Solutions Inc.) is in a volatility expansion state on the weekly chart, with a confidence level of 72%. Key support is at $39.0 and key resistance at $53.0. Weekly price surged to new swing highs near $53 then pulled back to ~$46, still holding well above all key MAs; momentum elevated (RSI ~64) with volatility expansion after a breakout.
Bullish continuation after digestion: price holds the ~$39–$42 breakout retest zone, forms a higher low, then attempts a second push to retest the ~$53 swing high and extend to the next fib extension.
Deeper mean-reversion: the post-spike pullback extends, price revisits the prior breakout shelf and rising fast MAs; if buyers fail to defend, it slides toward the bigger MA cluster near low-$30s.
Weekly close above $49.00 with follow-through (next week holds above $49.00).
Weekly close below $39.00 (loss of breakout structure and key prior congestion).
Start on breakout retest/structure support (~$42–$44), add on deeper support (~$38–$40), heavy add only on full mean-reversion to EMA50 area (~$32.5) where trend support should be strongest if the move is a Wave-3/Wave-5 advance.
Trim into prior swing-high supply (~$53) and likely fib extension zones (~$60–$64); close into a more extreme extension (~$70+) where weekly price would be very stretched above EMA50/EMA100 and reversal risk rises.
As of May 22, 2026, PDFS (Pdf Solutions Inc.) is in a volatility expansion state on the weekly chart with 72% confidence. Weekly price surged to new swing highs near $53 then pulled back to ~$46, still holding well above all key MAs; momentum elevated (RSI ~64) with volatility expansion after a breakout.
On the weekly timeframe, PDFS has key support at $39.0 and key resistance at $53.0. The most likely scenario (bullish) targets $53.0 and $60.0, with a revert level at $42.0.
PDFS (Pdf Solutions Inc.) is currently classified as volatility expansion on the weekly chart, with 72% confidence. Confirmation requires: Weekly close above $49.00 with follow-through (next week holds above $49.00). This would be invalidated by: Weekly close below $39.00 (loss of breakout structure and key prior congestion).
The most likely scenario (bullish) targets $53.0 and $60.0, with a revert level at $42.0. The alternative scenario (bearish) targets $39.0 and $32.5.
Multi-layer AI agents analyse 200+ stocks across daily, weekly, and monthly timeframes — producing market state classifications, price scenarios with targets, and position entry/exit levels. Daily charts updated every trading day at 6 PM ET. Weekly charts refresh Fridays. Monthly charts refresh on the last trading day of each month. No paywall. No sign-up required.
Built by Foliotrail.
All content on this website — including charts, analysis, price targets, support/resistance levels, and position zones — is generated entirely by AI and provided for educational and informational purposes only.
This is not financial advice. NEXUSNOIR VENTURES SL (the operator of this website) is not a registered investment adviser or broker-dealer. You should not make investment decisions based solely on this information. Always do your own research and consult a qualified financial advisor.
By continuing, you acknowledge that you have read and agree to our full disclaimer & terms of use and privacy policy.