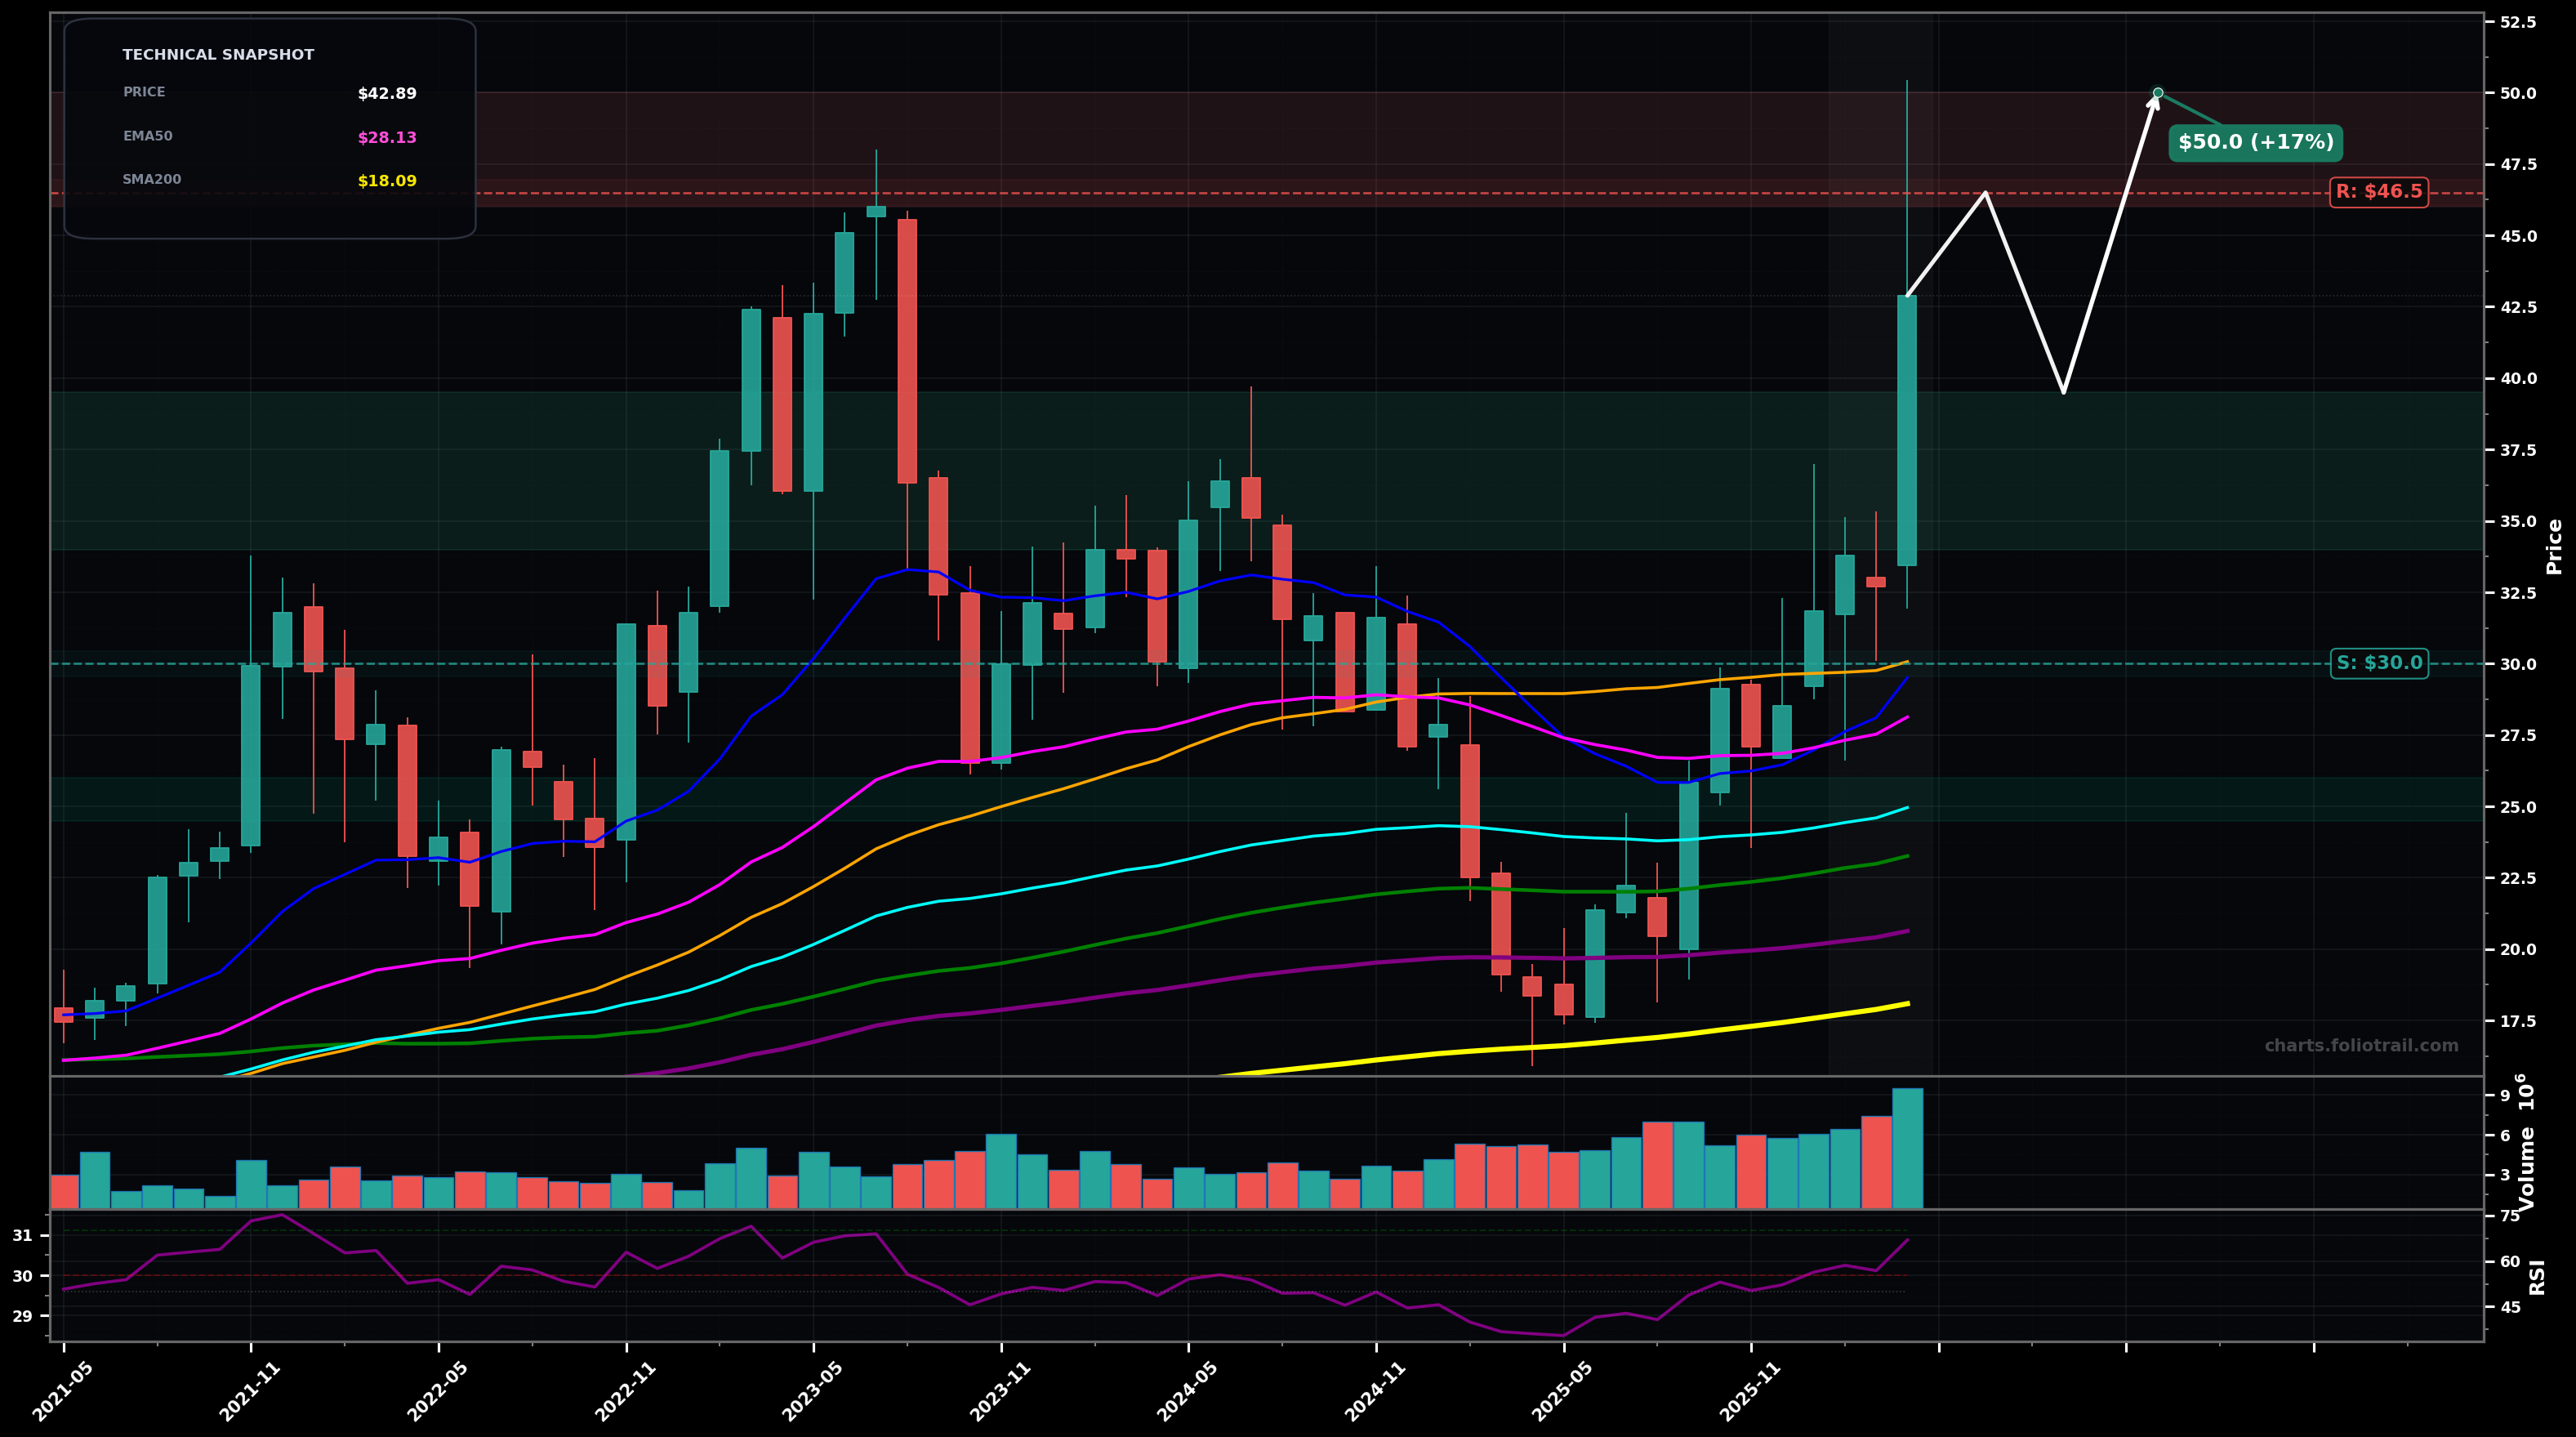
As of April 30, 2026, PDFS (Pdf Solutions Inc.) is in a volatility expansion state on the monthly chart, with a confidence level of 72%. Key support is at $30.0 and key resistance at $46.5. Monthly breakout with a large impulsive green candle into the low $40s, reclaiming the $30 area and accelerating above EMA50/EMA100/SMA50 on rising volume; RSI ~67 (strong momentum, near overbought).
Bullish continuation: the breakout consolidates above prior resistance (~$40/$30 zone) and makes a push to retest the prior swing-high supply area in the mid/high $40s; if momentum persists, an extension toward the psychological $50 area becomes plausible.
Bearish pullback/mean reversion: after the vertical monthly candle, price fades back to retest the breakout shelf around the confluence of SMA50 (~$30.07) and the prior range top; if that fails, a deeper retrace toward EMA100 (~$25) follows (common after wave-3-like thrusts).
2 monthly closes holding above $40.00
Monthly close back below $30.00
Start on a controlled pullback (post-breakout digestion), add at the key $30 breakout retest (SMA50/round-number), heavy add only near EMA100/structural support if a deeper retrace occurs.
Trim into prior supply/psych levels after volatility expansion; increase trimming on extension (likely fib/impulse stretch) and fully exit on extreme multi-year overextension above the MA stack.
As of April 30, 2026, PDFS (Pdf Solutions Inc.) is in a volatility expansion state on the monthly chart with 72% confidence. Monthly breakout with a large impulsive green candle into the low $40s, reclaiming the $30 area and accelerating above EMA50/EMA100/SMA50 on rising volume; RSI ~67 (strong momentum, near overbought).
On the monthly timeframe, PDFS has key support at $30.0 and key resistance at $46.5. The most likely scenario (bullish) targets $46.5 and $50.0, with a revert level at $39.5.
PDFS (Pdf Solutions Inc.) is currently classified as volatility expansion on the monthly chart, with 72% confidence. Confirmation requires: 2 monthly closes holding above $40.00 This would be invalidated by: Monthly close back below $30.00
The most likely scenario (bullish) targets $46.5 and $50.0, with a revert level at $39.5. The alternative scenario (bearish) targets $30.0 and $25.0.
Multi-layer AI agents analyse 200+ stocks across daily, weekly, and monthly timeframes — producing market state classifications, price scenarios with targets, and position entry/exit levels. Daily charts updated every trading day at 6 PM ET. Weekly charts refresh Fridays. Monthly charts refresh on the last trading day of each month. No paywall. No sign-up required.
Built by Foliotrail.
All content on this website — including charts, analysis, price targets, support/resistance levels, and position zones — is generated entirely by AI and provided for educational and informational purposes only.
This is not financial advice. NEXUSNOIR VENTURES SL (the operator of this website) is not a registered investment adviser or broker-dealer. You should not make investment decisions based solely on this information. Always do your own research and consult a qualified financial advisor.
By continuing, you acknowledge that you have read and agree to our full disclaimer & terms of use and privacy policy.