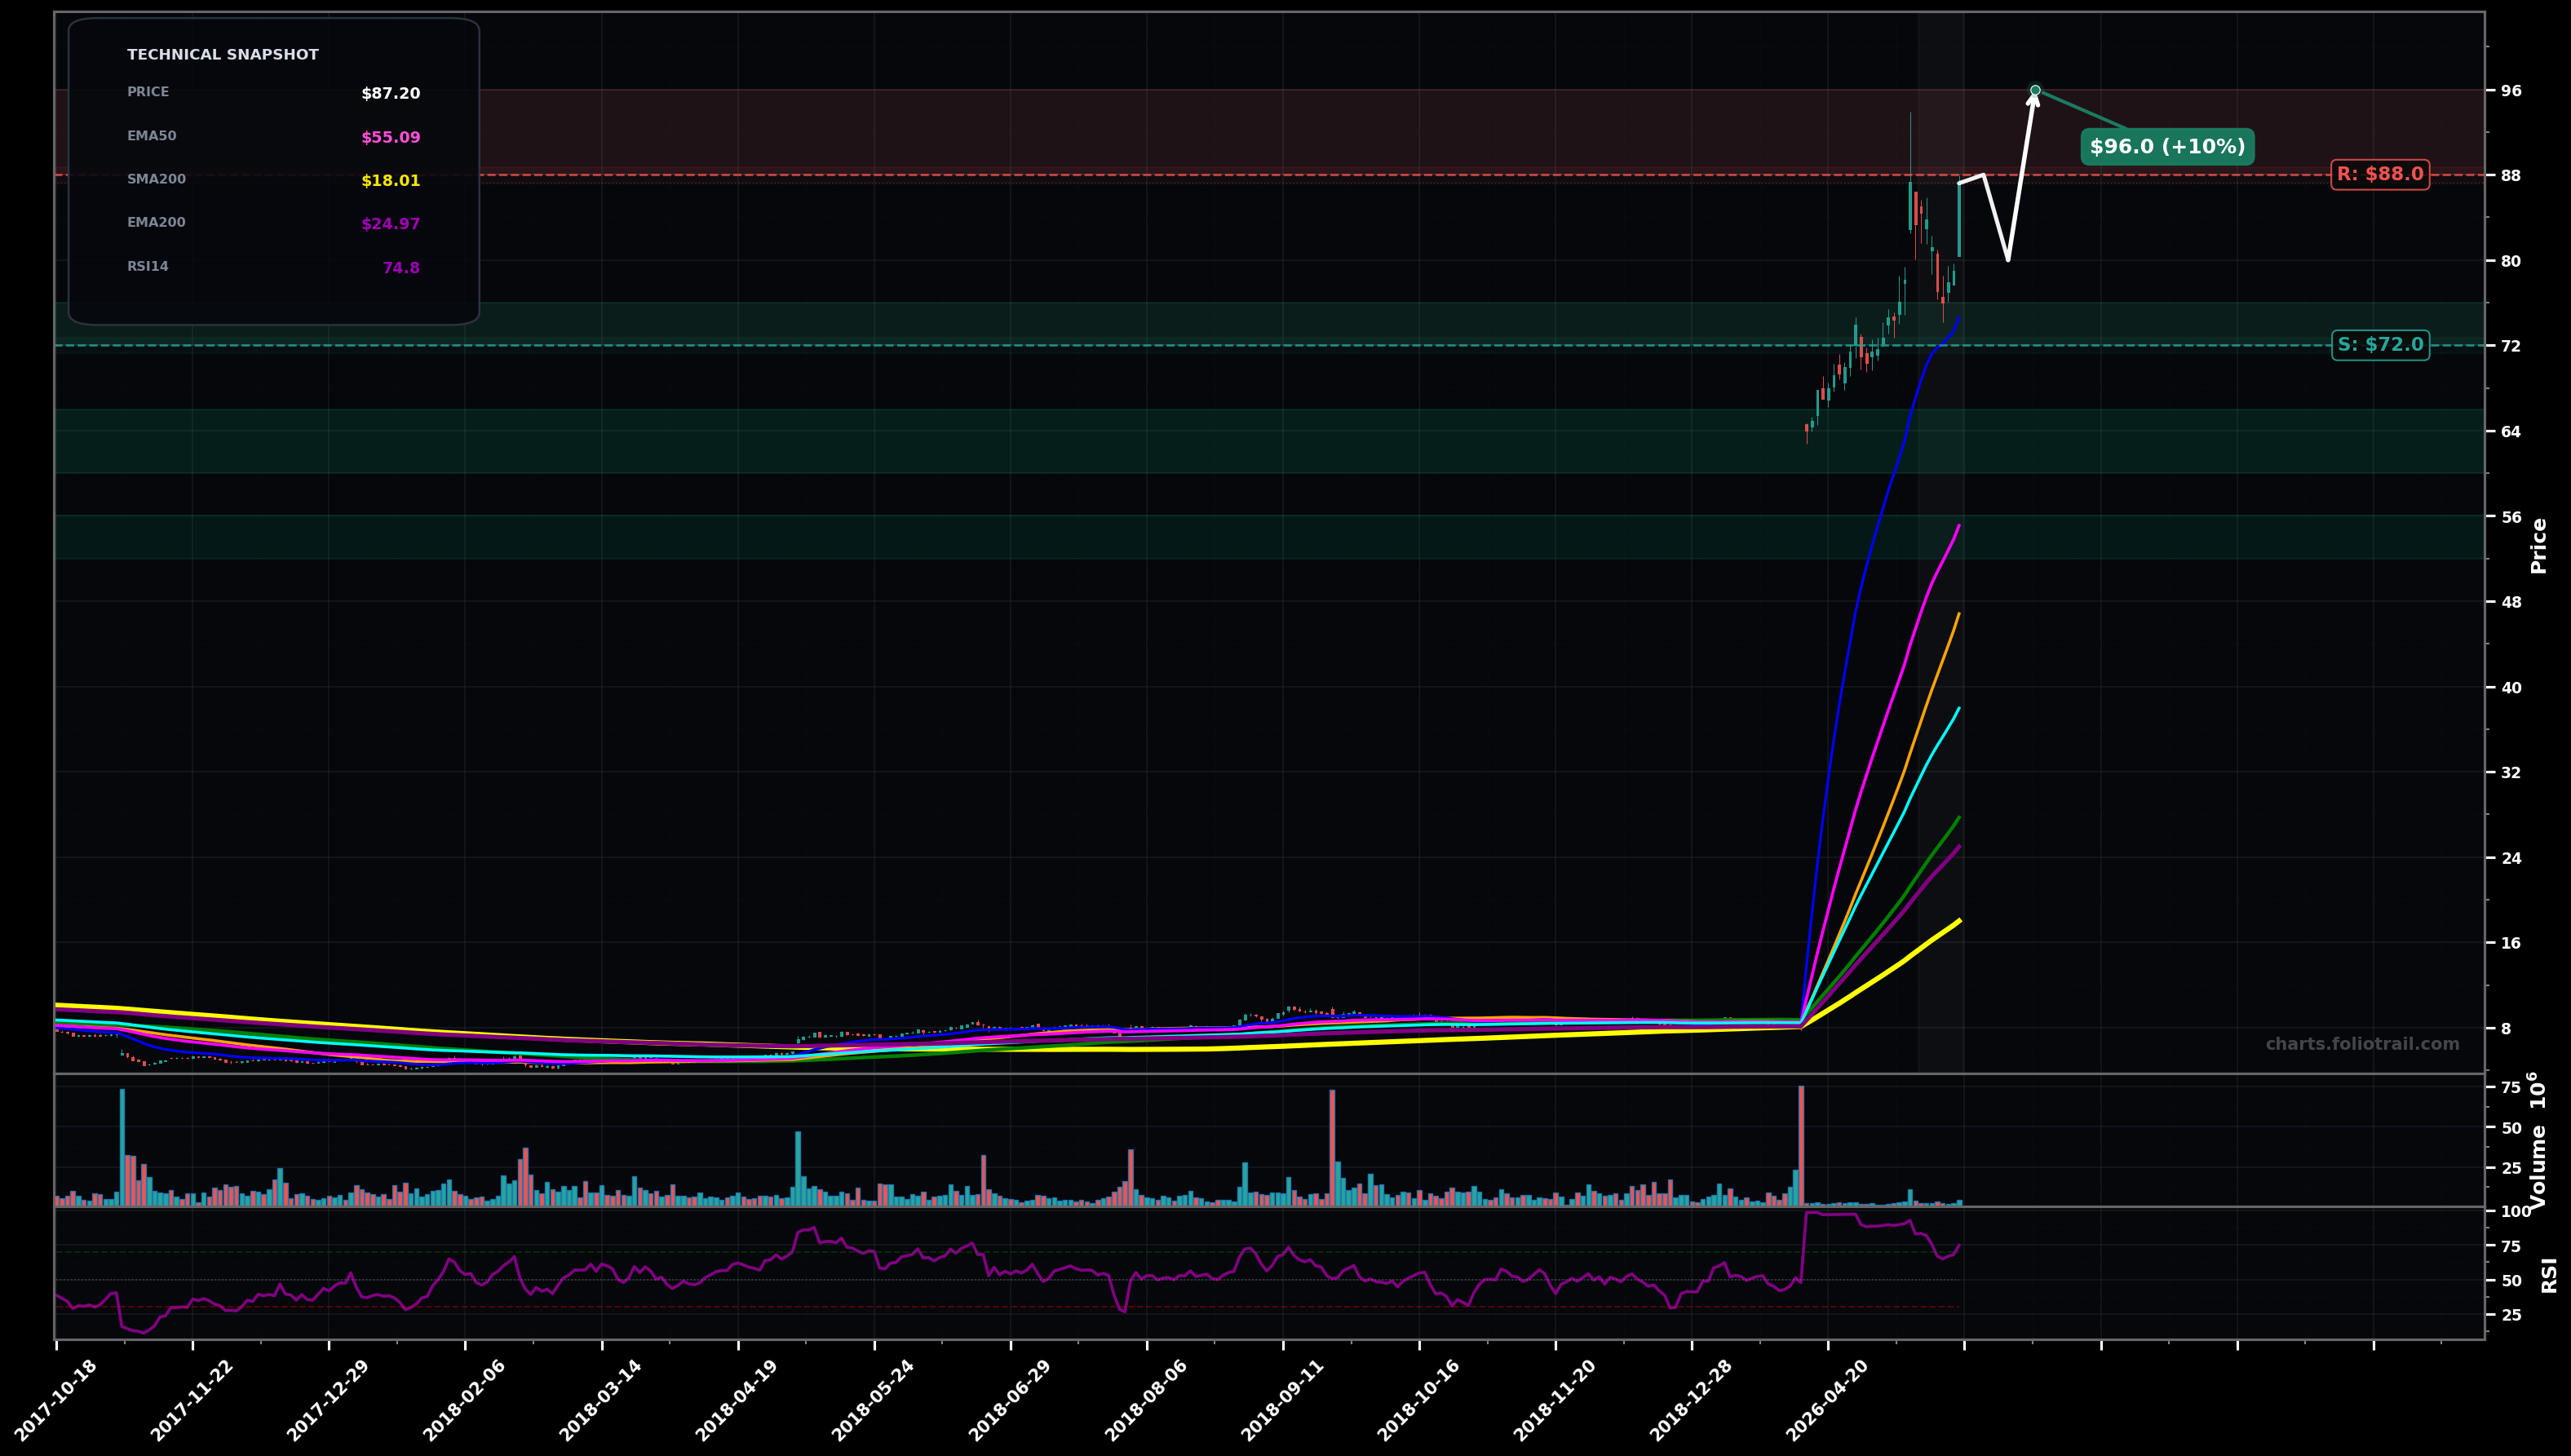
As of May 22, 2026, P (Everpure Inc.) is in a parabolic state on the daily chart, with a confidence level of 74%. Key support is at $72.0 and key resistance at $88.0. Sharp impulsive advance to ~$88, followed by a quick pullback into the mid-$70s and a strong rebound back toward highs; RSI still elevated (~75).
Bullish continuation: price consolidates above prior breakout area and pushes to a marginal new high; likely the tail end of an Elliott Wave 3 or 5 extension (risk of sharp wave-4 style pullback remains).
Bearish mean-reversion: a parabolic unwind (wave-4 / ABC) pulls price back toward the first major dynamic supports (EMA20 then EMA50) before any sustainable new leg up.
Daily close above $88 with follow-through (2+ closes holding above $88).
Daily close below $72 would signal the parabolic phase is failing and a deeper mean-reversion is likely.
Start near the most recent swing/pullback support ($72-76); add on deeper retrace toward the gap between price and EMA50 (~$55) and prior breakout structure ($60-66); heavy add at EMA50 confluence/likely Fib retrace zone (~$52-56).
Parabolic stretches typically revert; trim into/above prior highs ($88-96) and further into extension territory ($96-110); consider full exit if a blow-off extension reaches ~$110-130 (likely >1.618-type extension from the recent swing) while RSI remains elevated.
As of May 22, 2026, P (Everpure Inc.) is in a parabolic state on the daily chart with 74% confidence. Sharp impulsive advance to ~$88, followed by a quick pullback into the mid-$70s and a strong rebound back toward highs; RSI still elevated (~75).
On the daily timeframe, P has key support at $72.0 and key resistance at $88.0. The most likely scenario (bullish) targets $88.0 and $96.0, with a revert level at $80.0.
P (Everpure Inc.) is currently classified as parabolic on the daily chart, with 74% confidence. Confirmation requires: Daily close above $88 with follow-through (2+ closes holding above $88). This would be invalidated by: Daily close below $72 would signal the parabolic phase is failing and a deeper mean-reversion is likely.
The most likely scenario (bullish) targets $88.0 and $96.0, with a revert level at $80.0. The alternative scenario (bearish) targets $74.0 and $56.0.
Multi-layer AI agents analyse 200+ stocks across daily, weekly, and monthly timeframes — producing market state classifications, price scenarios with targets, and position entry/exit levels. Daily charts updated every trading day at 6 PM ET. Weekly charts refresh Fridays. Monthly charts refresh on the last trading day of each month. No paywall. No sign-up required.
Built by Foliotrail.
All content on this website — including charts, analysis, price targets, support/resistance levels, and position zones — is generated entirely by AI and provided for educational and informational purposes only.
This is not financial advice. NEXUSNOIR VENTURES SL (the operator of this website) is not a registered investment adviser or broker-dealer. You should not make investment decisions based solely on this information. Always do your own research and consult a qualified financial advisor.
By continuing, you acknowledge that you have read and agree to our full disclaimer & terms of use and privacy policy.