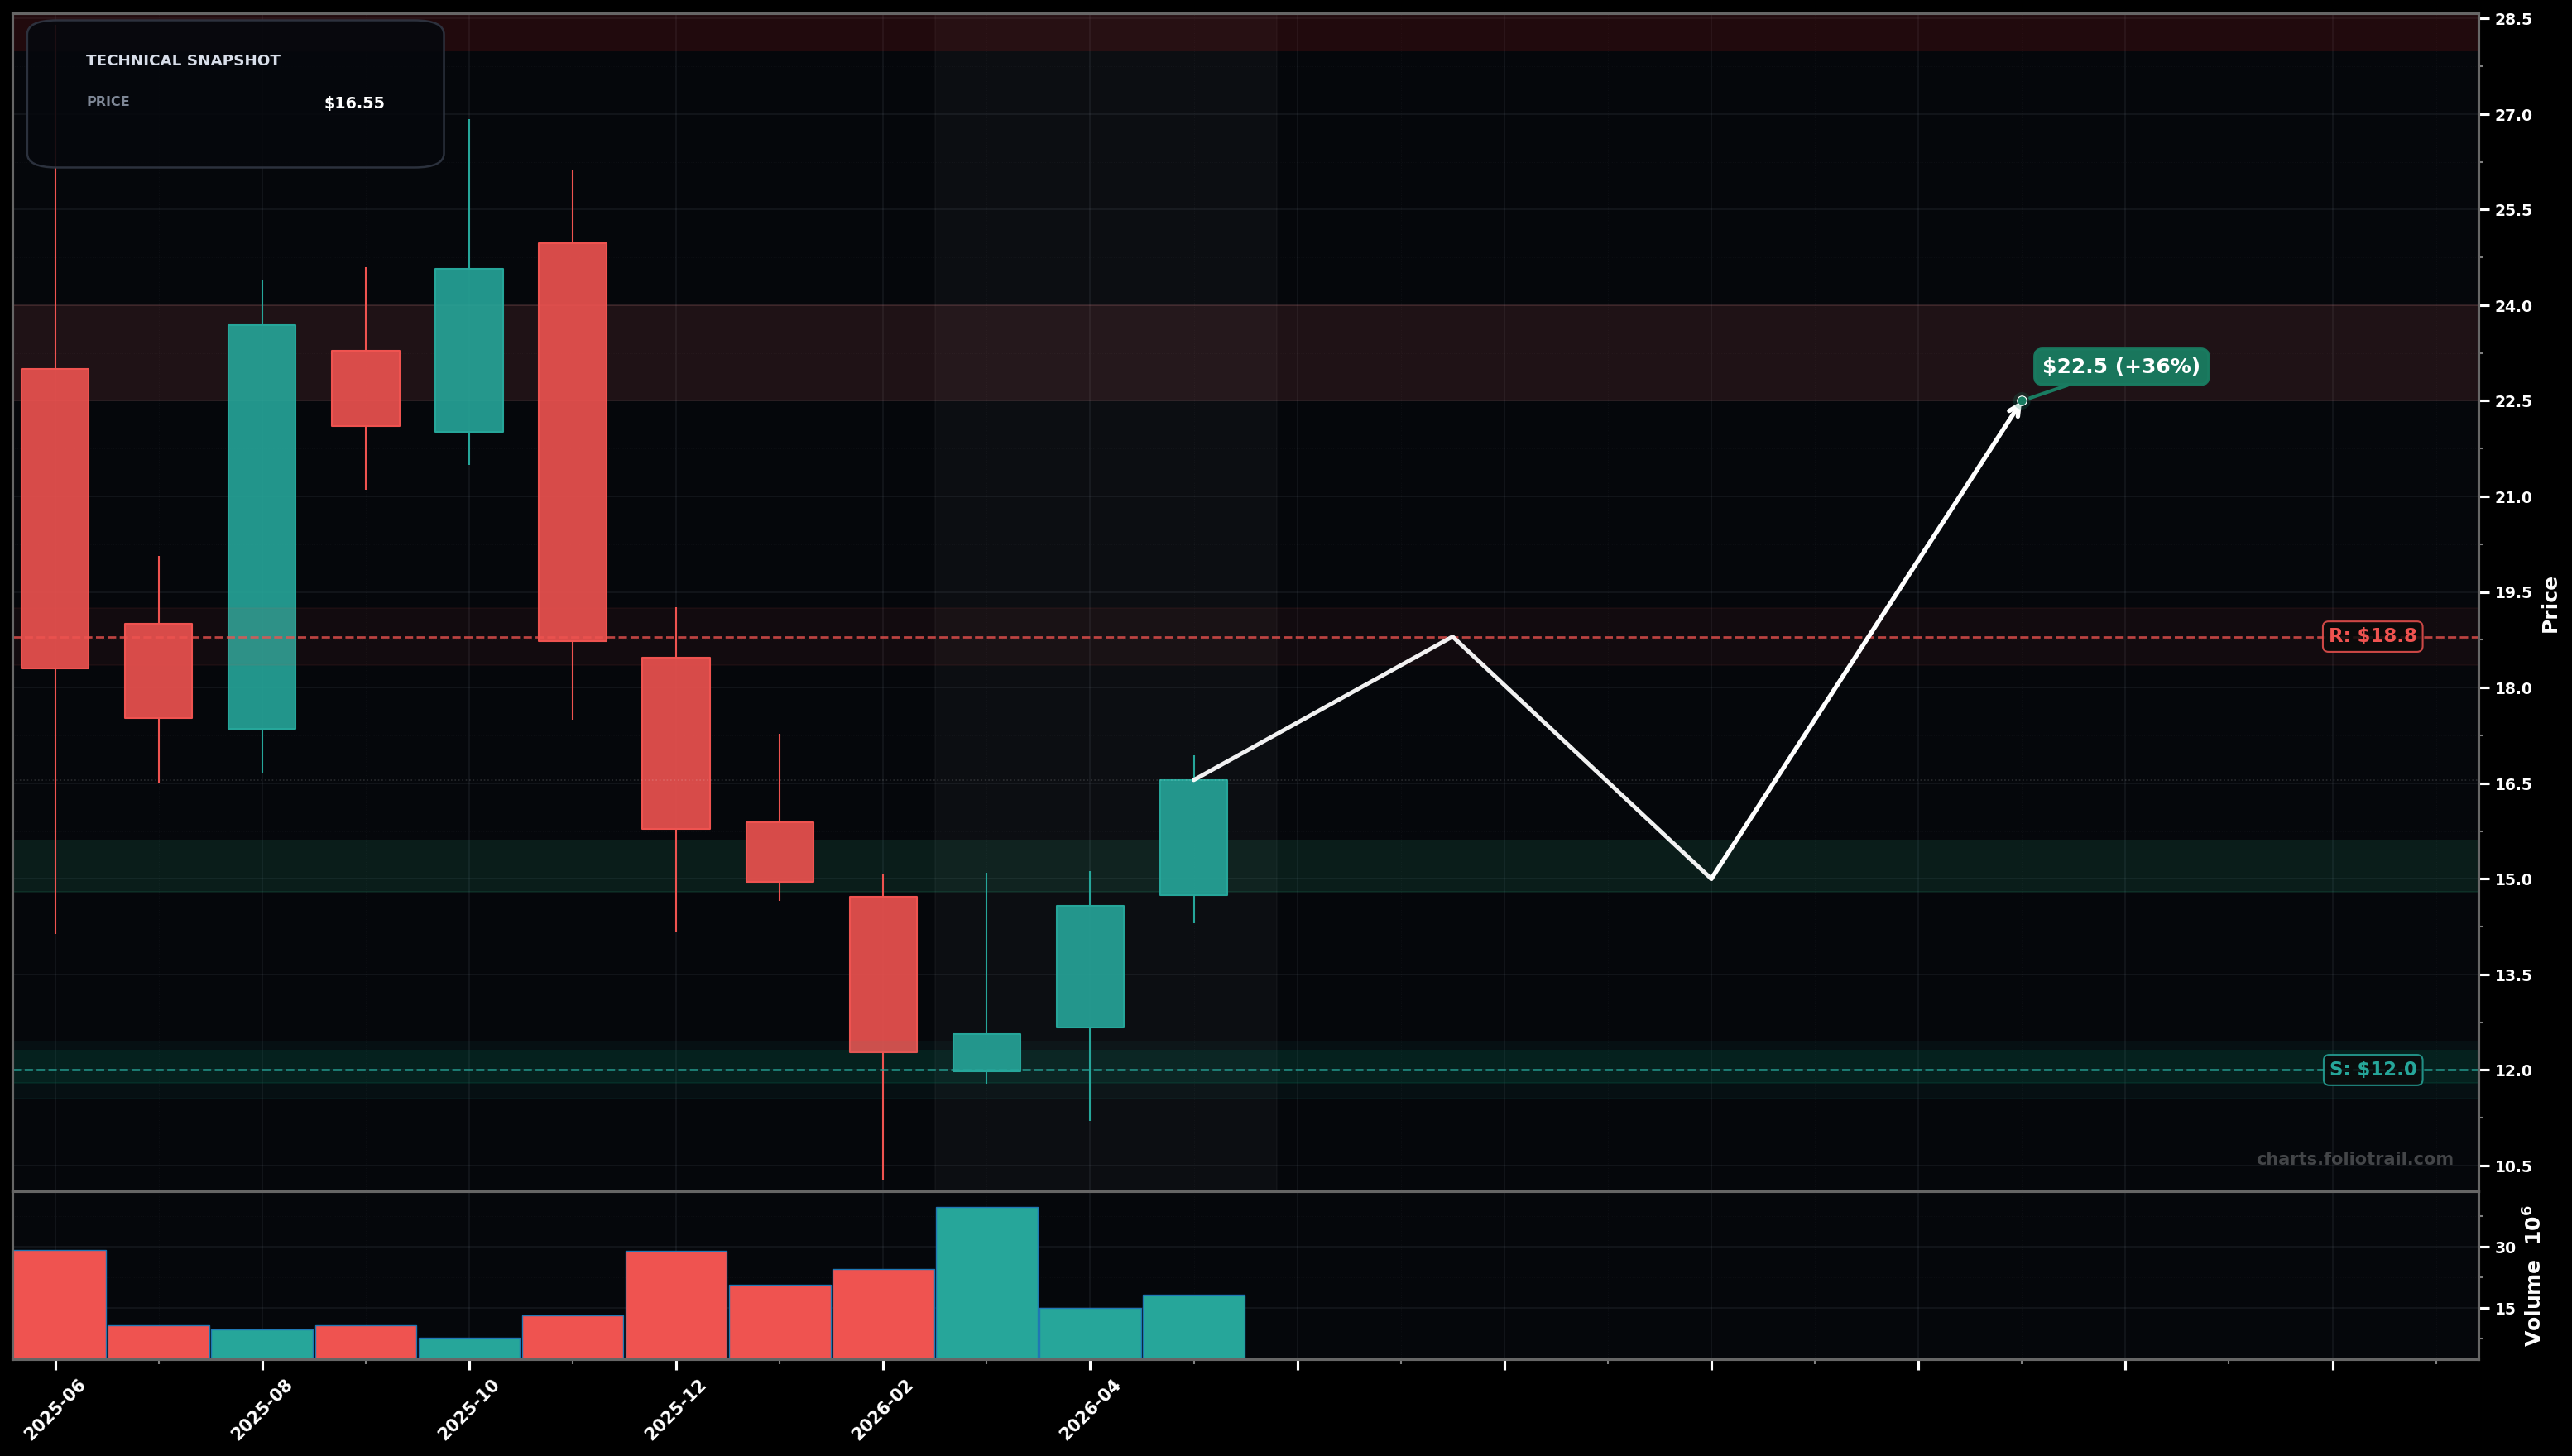
As of May 15, 2026, OMDA (Omada Health, Inc.) is in a bottoming attempt state on the monthly chart, with a confidence level of 61%. Key support is at $12.0 and key resistance at $18.8. Monthly rebound off the ~$12 swing-low area; last candle pushed back to ~$16.55 but still below the prior breakdown zone (~$18–$19).
Base-building continues: price consolidates above ~$12 and grinds higher; a breakout over the ~$18–$19 supply zone opens a move toward the low-$20s (prior range).
Failed bounce: rally stalls under ~$18–$19 and rolls over, retesting the ~$12 swing low; if that breaks, downside can accelerate into the prior wick/void area.
Monthly close above $18.80
Monthly close below $12.00
Scale-in around the rebound pivot (~$15) and add closer to the base floor; heavy add only on a controlled retest of the key swing-low support (~$12).
Trim into prior supply/upper-range levels (likely fib retrace of the selloff); increasingly aggressive profit-taking near the old highs/extension zone where mean-reversion risk rises.
As of May 15, 2026, OMDA (Omada Health, Inc.) is in a bottoming attempt state on the monthly chart with 61% confidence. Monthly rebound off the ~$12 swing-low area; last candle pushed back to ~$16.55 but still below the prior breakdown zone (~$18–$19).
On the monthly timeframe, OMDA has key support at $12.0 and key resistance at $18.8. The most likely scenario (bullish) targets $18.8 and $22.5, with a revert level at $15.0.
OMDA (Omada Health, Inc.) is currently classified as bottoming attempt on the monthly chart, with 61% confidence. Confirmation requires: Monthly close above $18.80 This would be invalidated by: Monthly close below $12.00
The most likely scenario (bullish) targets $18.8 and $22.5, with a revert level at $15.0. The alternative scenario (bearish) targets $12.0 and $10.5.
Multi-layer AI agents analyse 200+ stocks across daily, weekly, and monthly timeframes — producing market state classifications, price scenarios with targets, and position entry/exit levels. Daily charts updated every trading day at 6 PM ET. Weekly charts refresh Fridays. Monthly charts refresh on the last trading day of each month. No paywall. No sign-up required.
Built by Foliotrail.
All content on this website — including charts, analysis, price targets, support/resistance levels, and position zones — is generated entirely by AI and provided for educational and informational purposes only.
This is not financial advice. NEXUSNOIR VENTURES SL (the operator of this website) is not a registered investment adviser or broker-dealer. You should not make investment decisions based solely on this information. Always do your own research and consult a qualified financial advisor.
By continuing, you acknowledge that you have read and agree to our full disclaimer & terms of use and privacy policy.