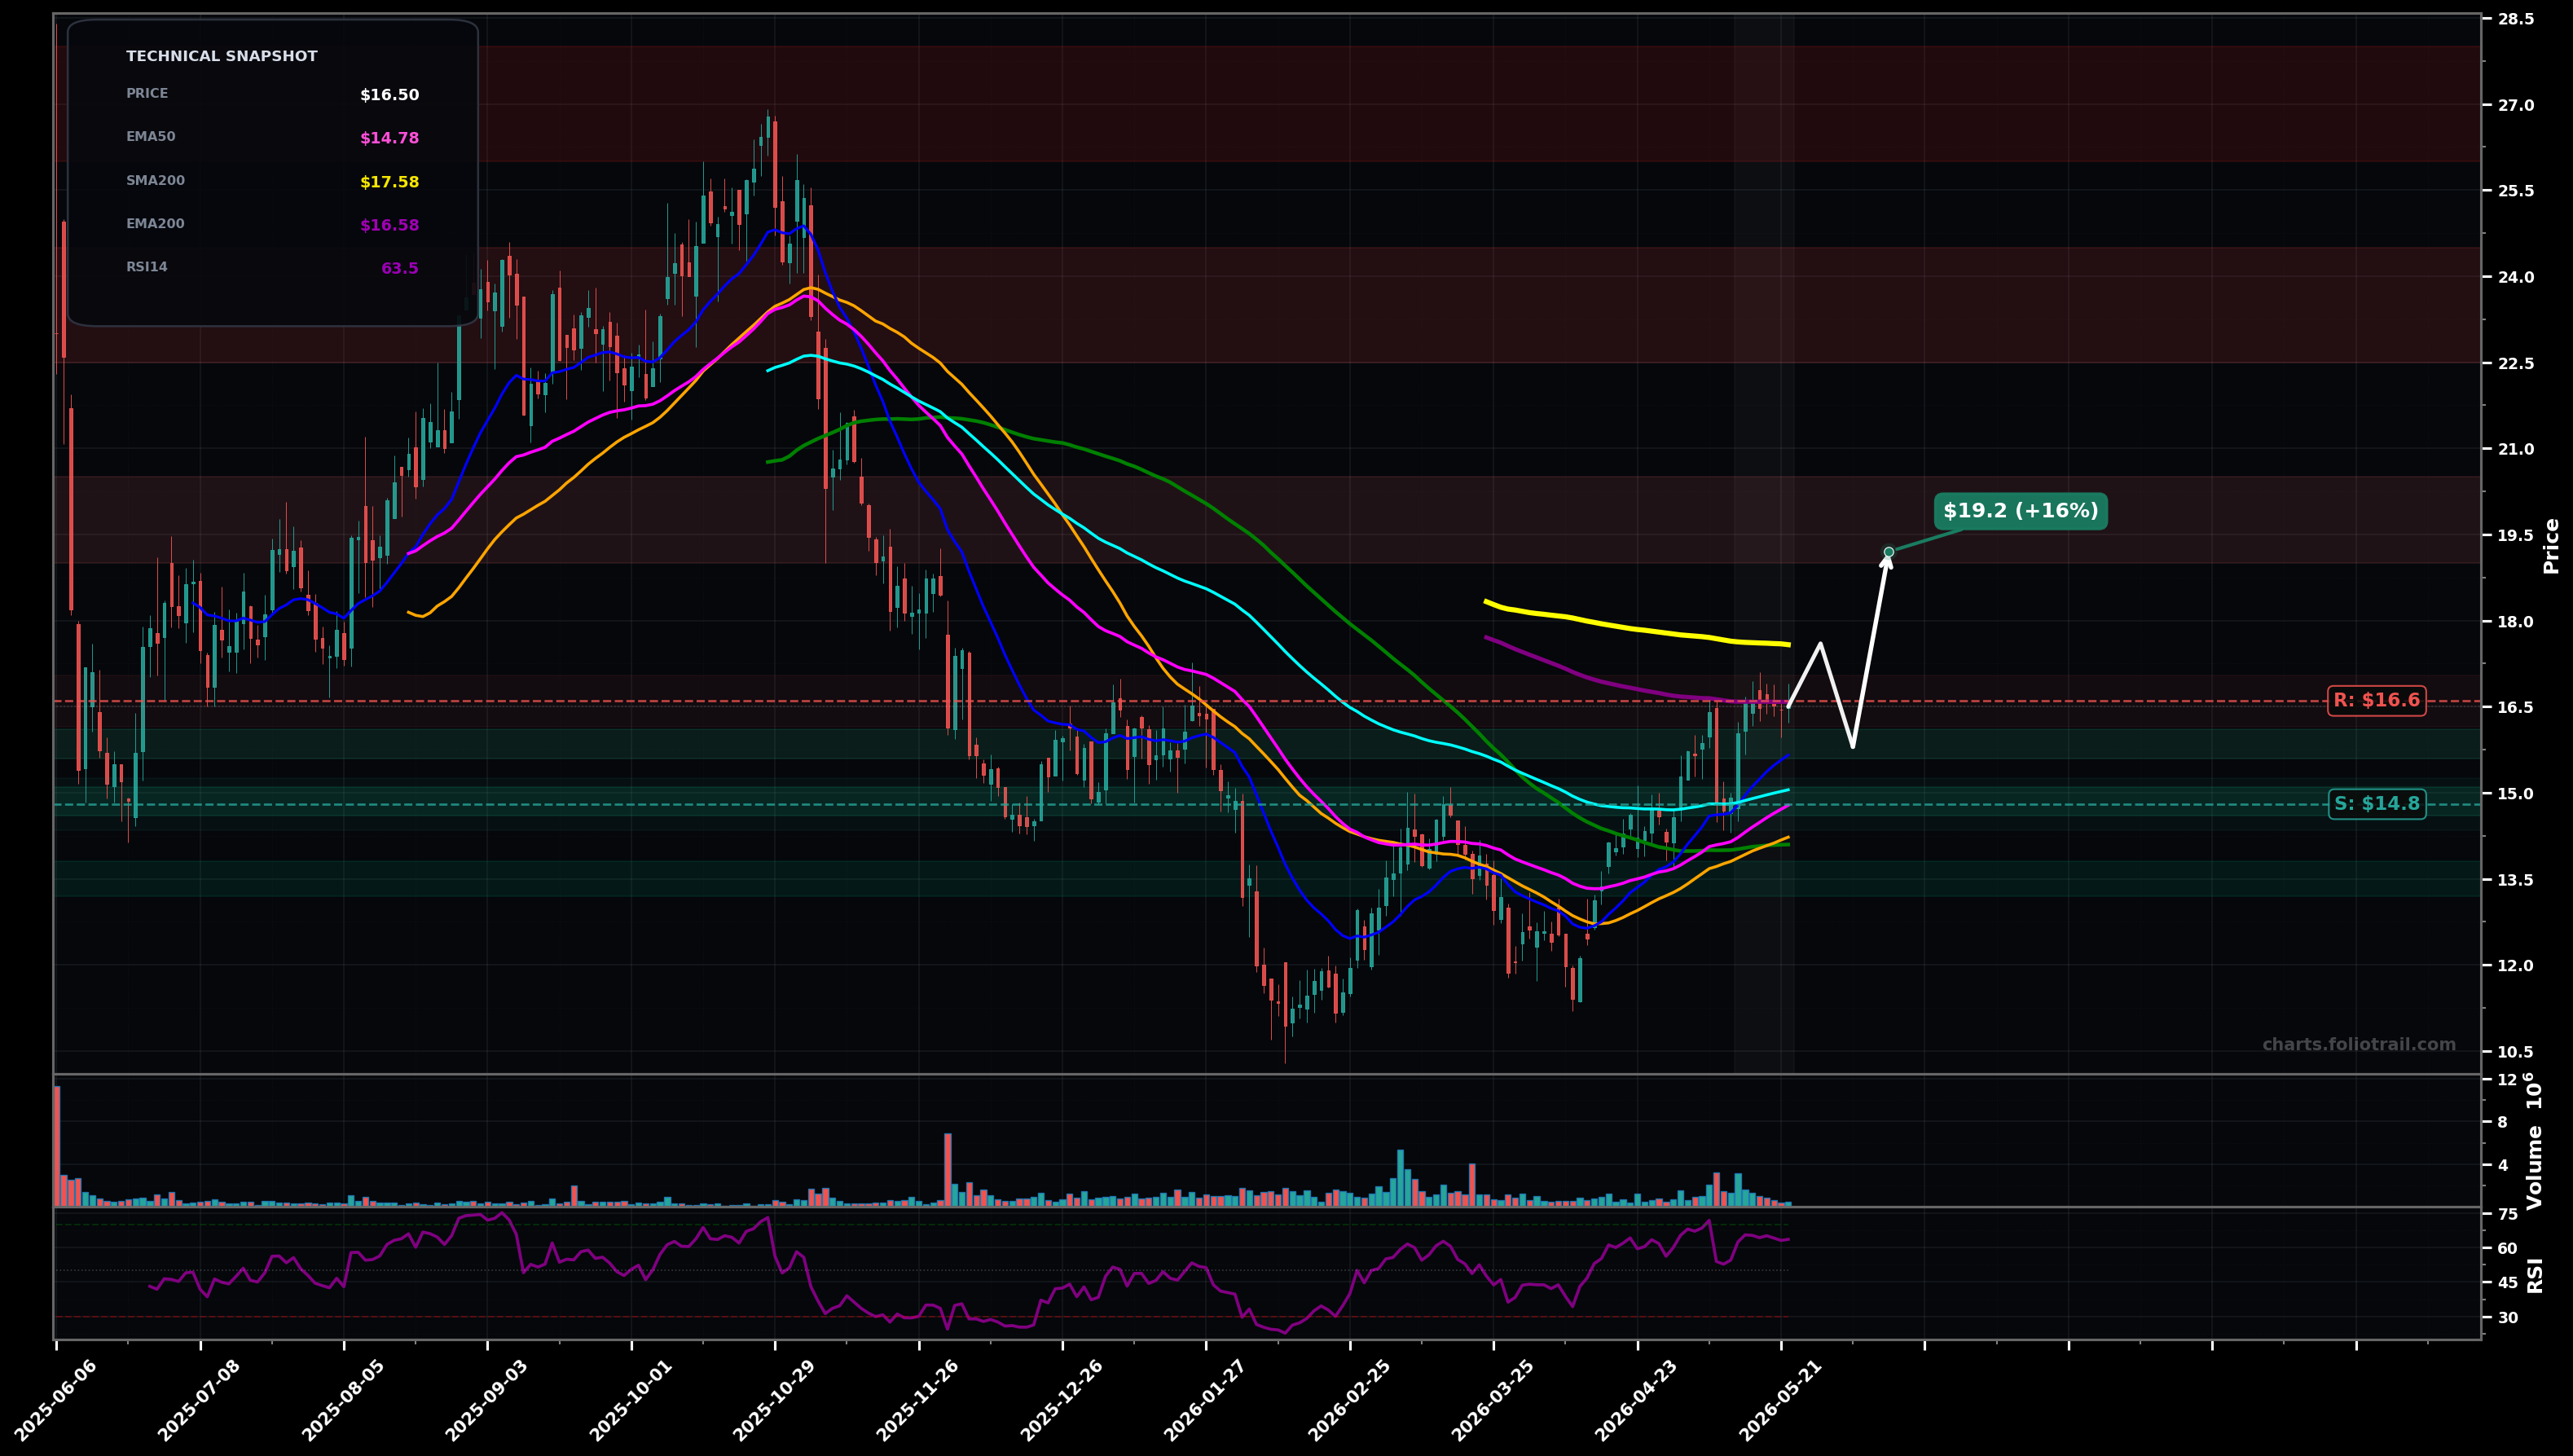
As of May 22, 2026, OMDA (Omada Health, Inc.) is in a bottoming attempt state on the daily chart, with a confidence level of 64%. Key support is at $14.8 and key resistance at $16.6. Price ~$16.50 is grinding up with HH/HL from the ~$12 area and is consolidating just below the long-term MAs (EMA200/SMA200) near ~$16.6–$17.6; RSI ~63 shows improving momentum.
Bullish continuation: shallow pullback/flag above EMA50, then push through EMA200 and attempt a full reclaim of SMA200; this would fit an Elliott Wave basing-to-impulse transition (likely wave (3) of a new up-leg after a completed A-B-C into ~$11–$12).
Bearish rejection: fail at EMA200/$16.6–$17.0, roll over into a deeper retrace of the recent upswing (Fibonacci-style pullback), retesting the prior breakout area; if that breaks, odds rise of a range reset back toward the spring low zone.
2+ daily closes above $17.60 (reclaim SMA200) with hold
Daily close back below $14.70 (loss of EMA50/near-term breakout base)
Start on controlled pullbacks into the breakout/EMA cluster; add on EMA50/EMA100 retest; heavy add near deeper Fib retrace/prior base support if the structure remains intact.
Trim into major prior supply zones from the left-side distribution and likely Fib extensions; progressively de-risk as price stretches far above rising intermediates and approaches prior swing-high resistance.
As of May 22, 2026, OMDA (Omada Health, Inc.) is in a bottoming attempt state on the daily chart with 64% confidence. Price ~$16.50 is grinding up with HH/HL from the ~$12 area and is consolidating just below the long-term MAs (EMA200/SMA200) near ~$16.6–$17.6; RSI ~63 shows improving momentum.
On the daily timeframe, OMDA has key support at $14.8 and key resistance at $16.6. The most likely scenario (bullish) targets $17.6 and $19.2, with a revert level at $15.8.
OMDA (Omada Health, Inc.) is currently classified as bottoming attempt on the daily chart, with 64% confidence. Confirmation requires: 2+ daily closes above $17.60 (reclaim SMA200) with hold This would be invalidated by: Daily close back below $14.70 (loss of EMA50/near-term breakout base)
The most likely scenario (bullish) targets $17.6 and $19.2, with a revert level at $15.8. The alternative scenario (bearish) targets $14.8 and $13.6.
Multi-layer AI agents analyse 200+ stocks across daily, weekly, and monthly timeframes — producing market state classifications, price scenarios with targets, and position entry/exit levels. Daily charts updated every trading day at 6 PM ET. Weekly charts refresh Fridays. Monthly charts refresh on the last trading day of each month. No paywall. No sign-up required.
Built by Foliotrail.
All content on this website — including charts, analysis, price targets, support/resistance levels, and position zones — is generated entirely by AI and provided for educational and informational purposes only.
This is not financial advice. NEXUSNOIR VENTURES SL (the operator of this website) is not a registered investment adviser or broker-dealer. You should not make investment decisions based solely on this information. Always do your own research and consult a qualified financial advisor.
By continuing, you acknowledge that you have read and agree to our full disclaimer & terms of use and privacy policy.