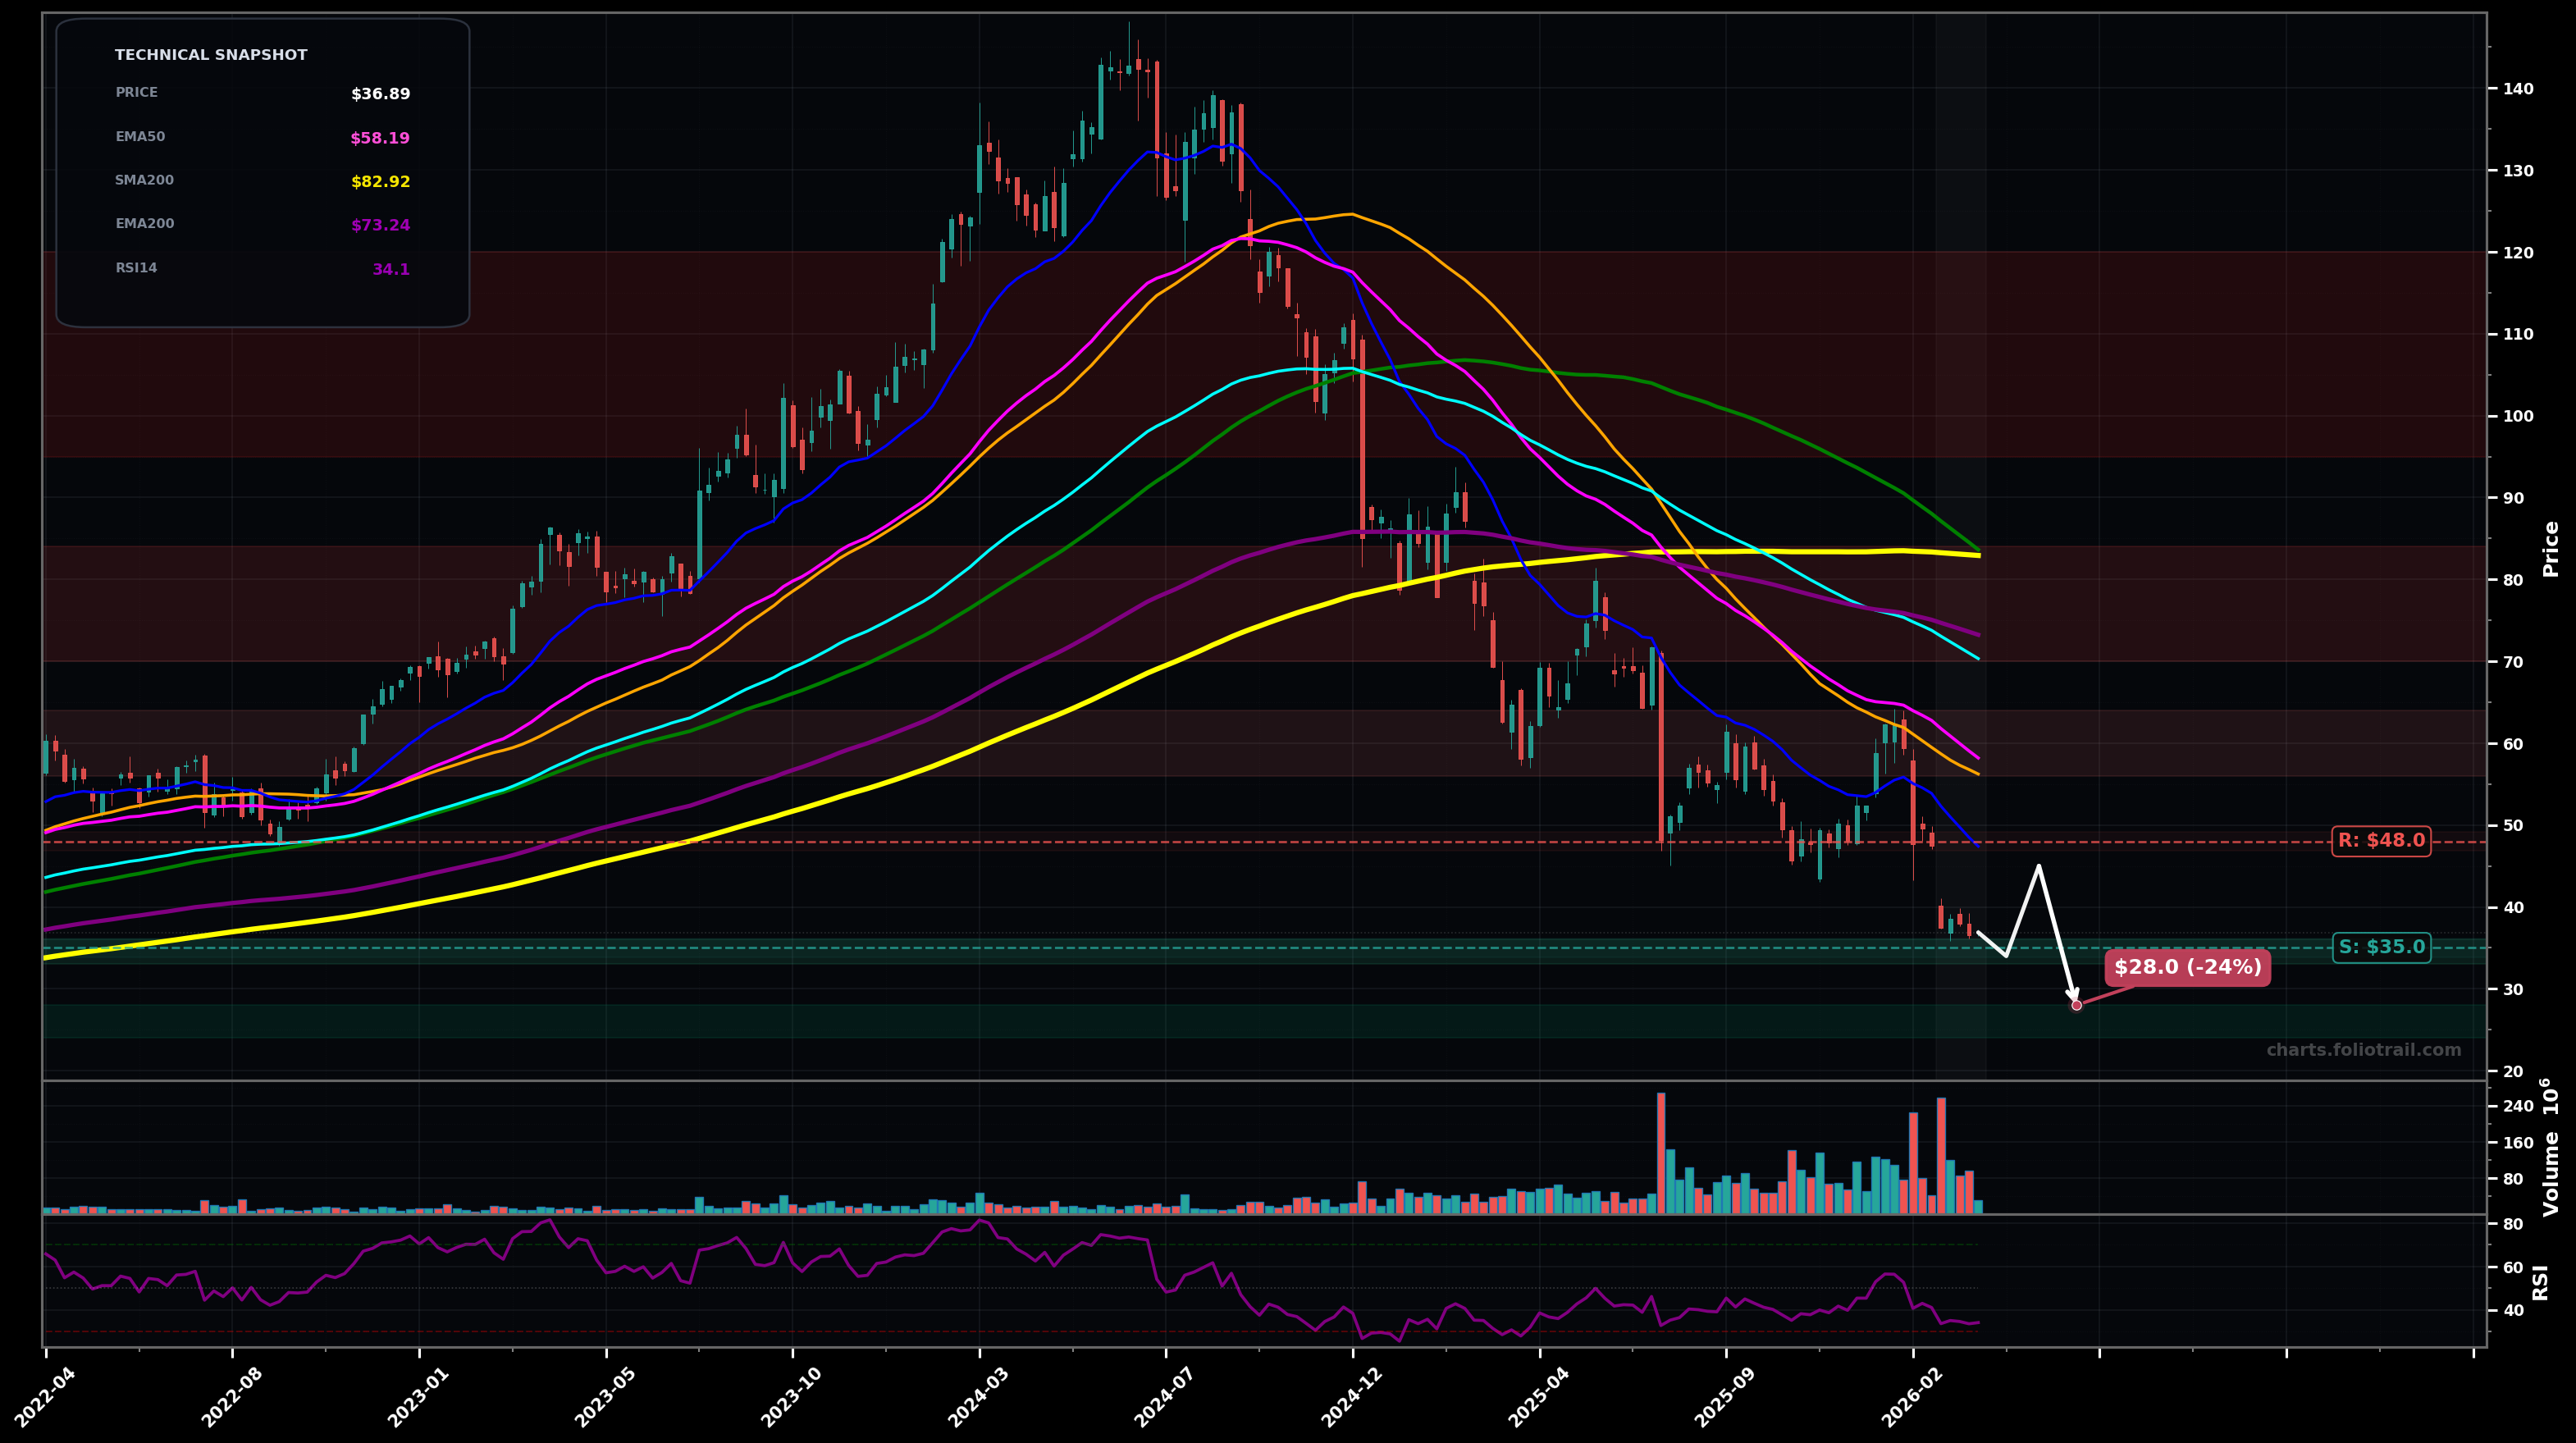
As of May 22, 2026, NVO (Novo Nordisk A/S Sponsored ADR) is in a downtrend state on the weekly chart, with a confidence level of 74%. Key support is at $40.0 and key resistance at $54.0. Weekly bounce off the ~$38–$40 swing low into ~$45, but price remains below EMA50/EMA100 and under prior breakdown zones.
Bear-market rally / mean-reversion continues toward the falling EMA50; rejection likely unless reclaim holds (typical Wave 4-type bounce after a strong Wave 3 down). Rough probability: 60%.
Support fails and the downtrend resumes (potential Wave 5 extension) with a retest/undercut of the ~$38 area and possible drift toward the next psychological/structure zone. Rough probability: 40%.
2+ weekly closes above ~$54 (EMA50/pink) with the next pullback holding above ~$50
Weekly close below ~$38 (recent swing-low base) would shift risk toward a renewed leg down
Start near the current swing-low support (~$40); add on an undercut/retest ($35–$38); heavy add only if capitulation pushes into the next demand/round-number zone ($30–$34) while monitoring for a higher low/reclaim.
Trim into first major downtrend resistance (EMA50 zone); trim more into EMA100/SMA100 supply; close into the heavier confluence overhead (SMA200 ~$82 + EMA200 ~$71 area above, where prior breakdowns can create strong distribution).
As of May 22, 2026, NVO (Novo Nordisk A/S Sponsored ADR) is in a downtrend state on the weekly chart with 74% confidence. Weekly bounce off the ~$38–$40 swing low into ~$45, but price remains below EMA50/EMA100 and under prior breakdown zones.
On the weekly timeframe, NVO has key support at $40.0 and key resistance at $54.0. The most likely scenario (bullish) targets $50.0 and $54.0, with a revert level at $44.0.
NVO (Novo Nordisk A/S Sponsored ADR) is currently classified as downtrend on the weekly chart, with 74% confidence. Confirmation requires: 2+ weekly closes above ~$54 (EMA50/pink) with the next pullback holding above ~$50 This would be invalidated by: Weekly close below ~$38 (recent swing-low base) would shift risk toward a renewed leg down
The most likely scenario (bullish) targets $50.0 and $54.0, with a revert level at $44.0. The alternative scenario (bearish) targets $38.0 and $32.0.
Multi-layer AI agents analyse 200+ stocks across daily, weekly, and monthly timeframes — producing market state classifications, price scenarios with targets, and position entry/exit levels. Daily charts updated every trading day at 6 PM ET. Weekly charts refresh Fridays. Monthly charts refresh on the last trading day of each month. No paywall. No sign-up required.
Built by Foliotrail.
All content on this website — including charts, analysis, price targets, support/resistance levels, and position zones — is generated entirely by AI and provided for educational and informational purposes only.
This is not financial advice. NEXUSNOIR VENTURES SL (the operator of this website) is not a registered investment adviser or broker-dealer. You should not make investment decisions based solely on this information. Always do your own research and consult a qualified financial advisor.
By continuing, you acknowledge that you have read and agree to our full disclaimer & terms of use and privacy policy.