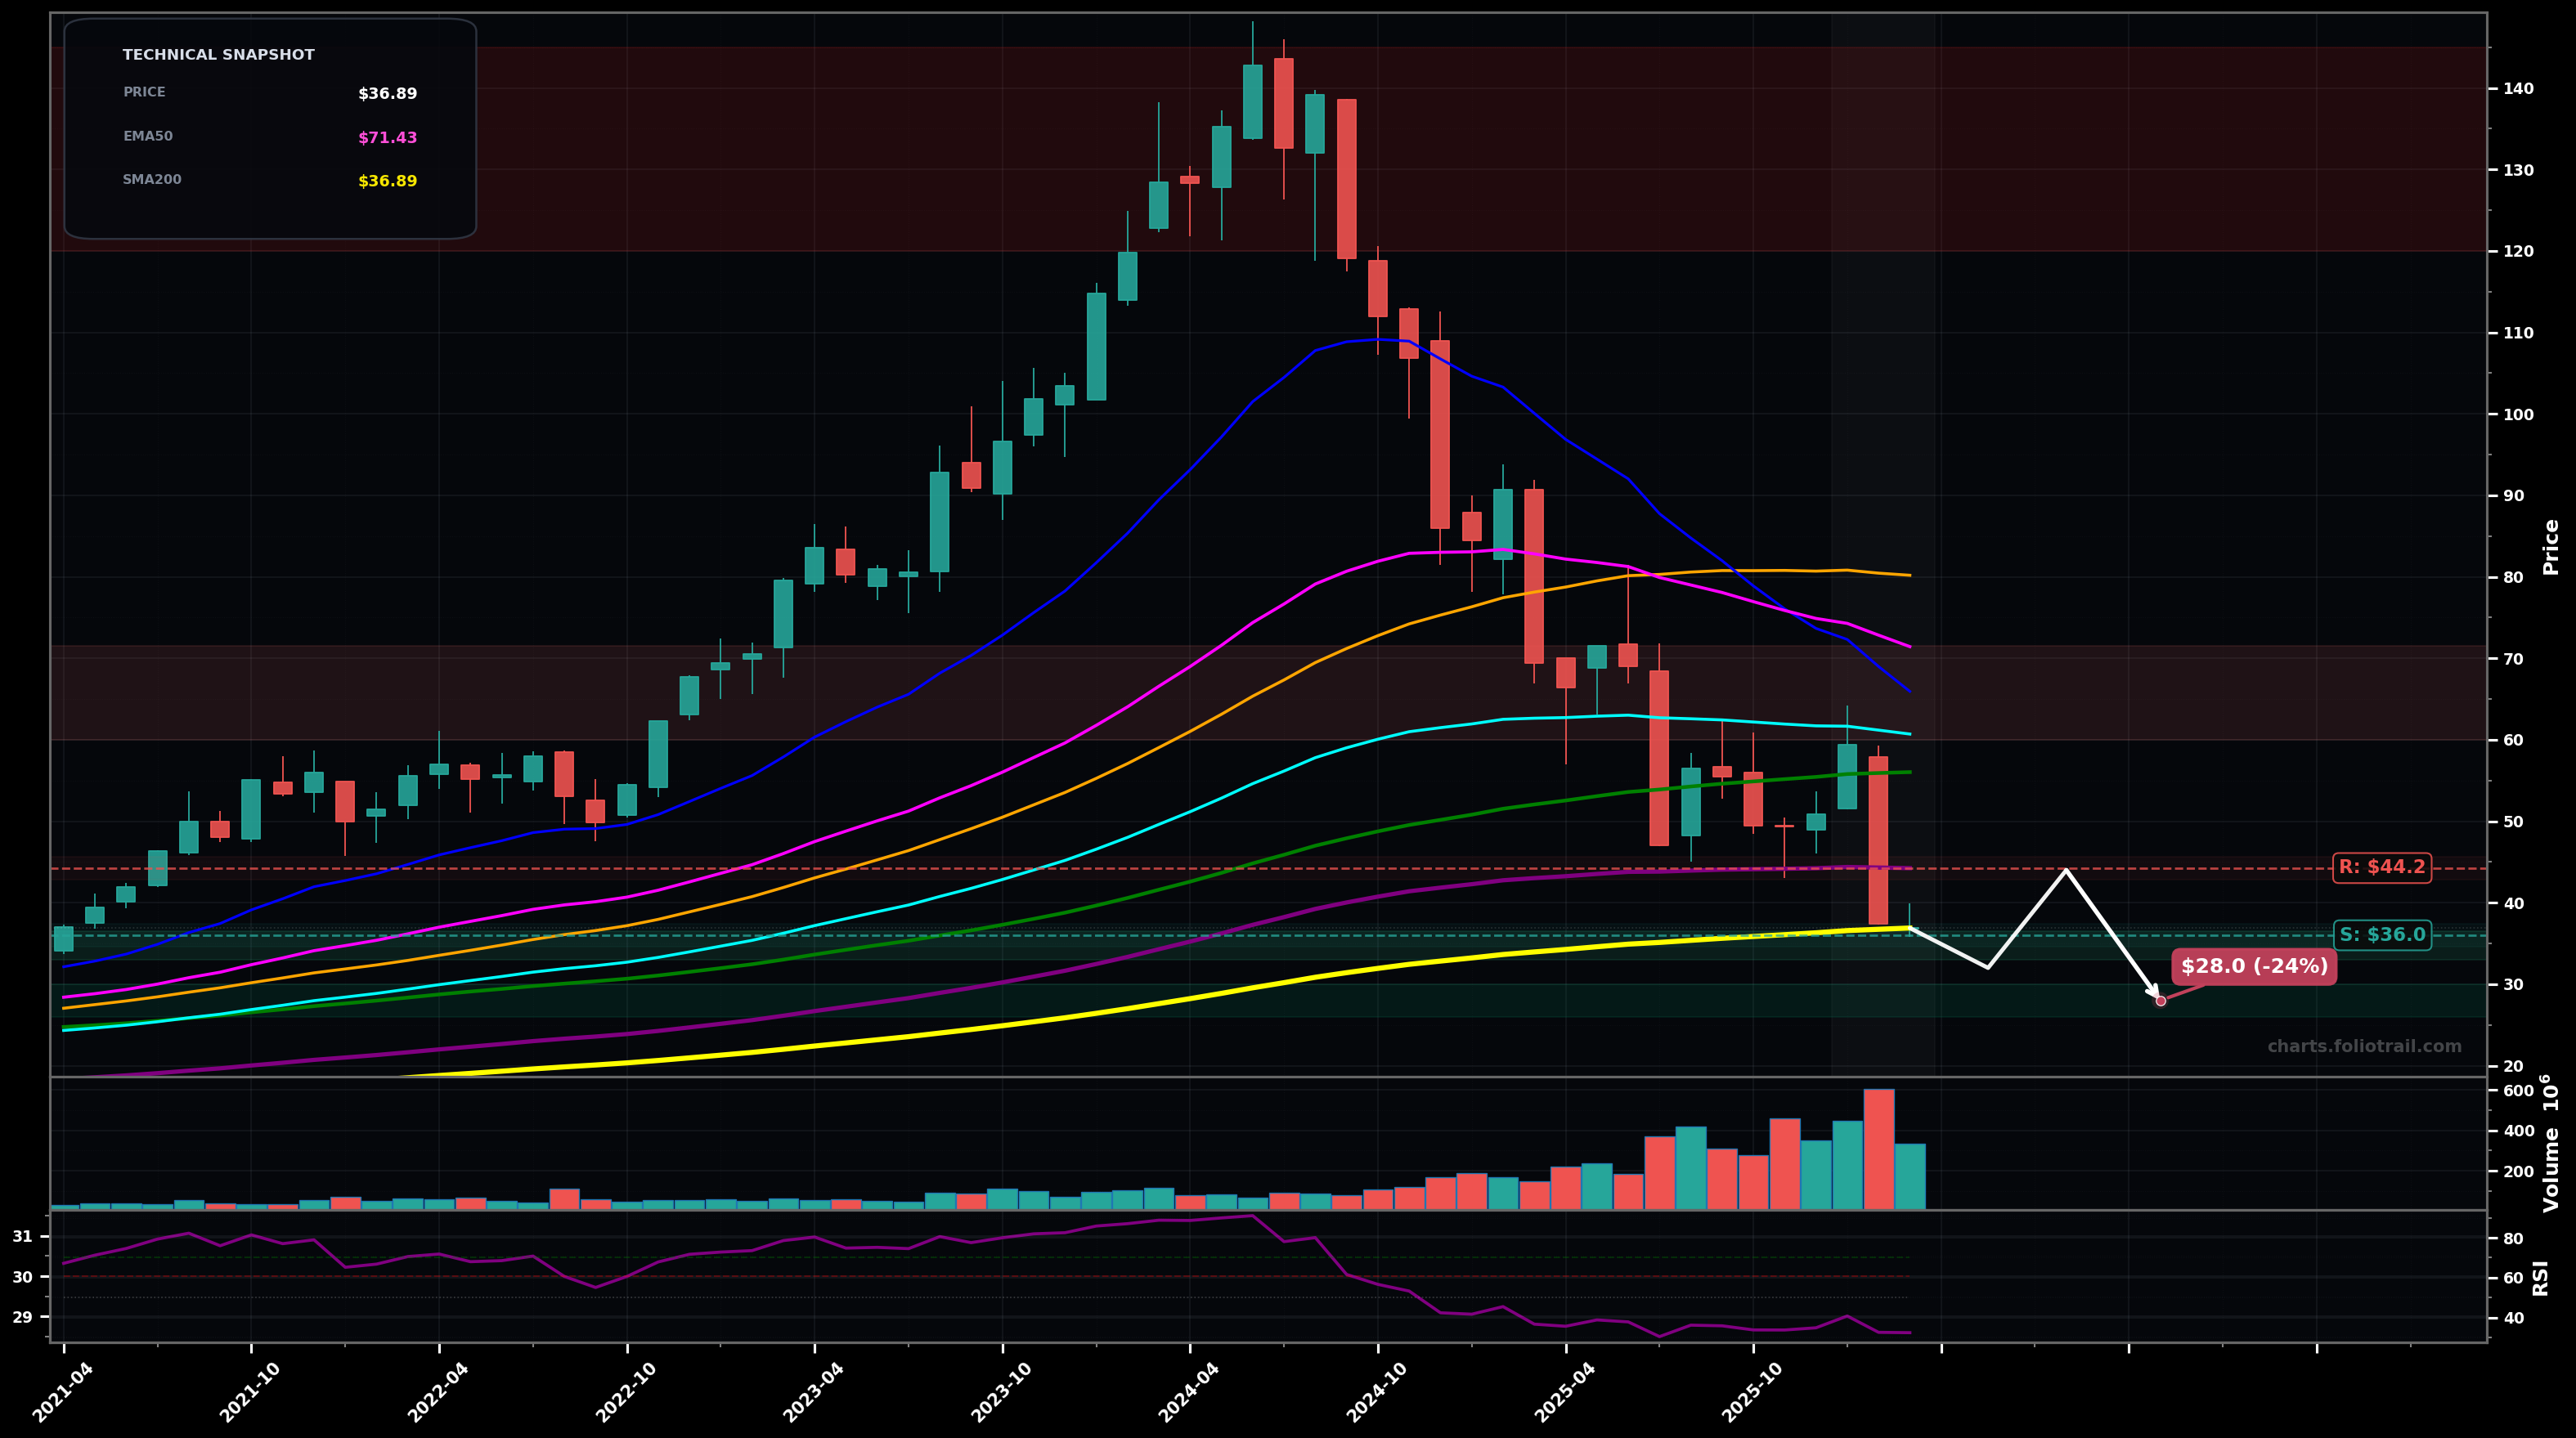
As of May 22, 2026, NVO (Novo Nordisk A/S Sponsored ADR) is in a bottoming attempt state on the monthly chart, with a confidence level of 56%. Key support is at $44.3 and key resistance at $56.4. Monthly downtrend from the $140s peak; recent sharp breakdown to ~$40 then small bounce; price ~$45 sitting just above EMA200 (~$44.33) while still well below EMA50/100 and SMA50/100.
Base-building around EMA200: price holds $44-$40 support, then mean-reverts toward the $56-$60 congestion (SMA100/EMA100) as Wave (A)/(1) of a larger corrective rebound; expect choppy swings (overhead supply). Prob ~60%.
Downtrend resumes: failure to reclaim $56 and a breakdown back under EMA200 triggers another sell leg (Wave (C)/(3) continuation) toward the prior base area; volatility can expand on a large red close near lows. Prob ~40%.
2+ monthly closes above $56.35 (SMA100) with higher low holding above $44.33 (EMA200).
Monthly close below $40.00 (break of the recent swing low zone) reopens downside toward the low-$30s.
Entries staged around EMA200 support ($44.33) and the key swing-low/200SMA area ($40-$37.27); heavier adds only if capitulation drives price into the prior long-term base zone (low-$30s).
Trim into major moving-average supply bands (EMA100/SMA100 then SMA50) and larger Fib/previous-distribution zones; full exit only if price revisits the prior cycle top region ($110-$140) where multi-year forward returns typically compress.
As of May 22, 2026, NVO (Novo Nordisk A/S Sponsored ADR) is in a bottoming attempt state on the monthly chart with 56% confidence. Monthly downtrend from the $140s peak; recent sharp breakdown to ~$40 then small bounce; price ~$45 sitting just above EMA200 (~$44.33) while still well below EMA50/100 and SMA50/100.
On the monthly timeframe, NVO has key support at $44.3 and key resistance at $56.4. The most likely scenario (bullish) targets $56.4 and $60.0, with a revert level at $49.0.
NVO (Novo Nordisk A/S Sponsored ADR) is currently classified as bottoming attempt on the monthly chart, with 56% confidence. Confirmation requires: 2+ monthly closes above $56.35 (SMA100) with higher low holding above $44.33 (EMA200). This would be invalidated by: Monthly close below $40.00 (break of the recent swing low zone) reopens downside toward the low-$30s.
The most likely scenario (bullish) targets $56.4 and $60.0, with a revert level at $49.0. The alternative scenario (bearish) targets $40.0 and $37.3.
Multi-layer AI agents analyse 200+ stocks across daily, weekly, and monthly timeframes — producing market state classifications, price scenarios with targets, and position entry/exit levels. Daily charts updated every trading day at 6 PM ET. Weekly charts refresh Fridays. Monthly charts refresh on the last trading day of each month. No paywall. No sign-up required.
Built by Foliotrail.
All content on this website — including charts, analysis, price targets, support/resistance levels, and position zones — is generated entirely by AI and provided for educational and informational purposes only.
This is not financial advice. NEXUSNOIR VENTURES SL (the operator of this website) is not a registered investment adviser or broker-dealer. You should not make investment decisions based solely on this information. Always do your own research and consult a qualified financial advisor.
By continuing, you acknowledge that you have read and agree to our full disclaimer & terms of use and privacy policy.