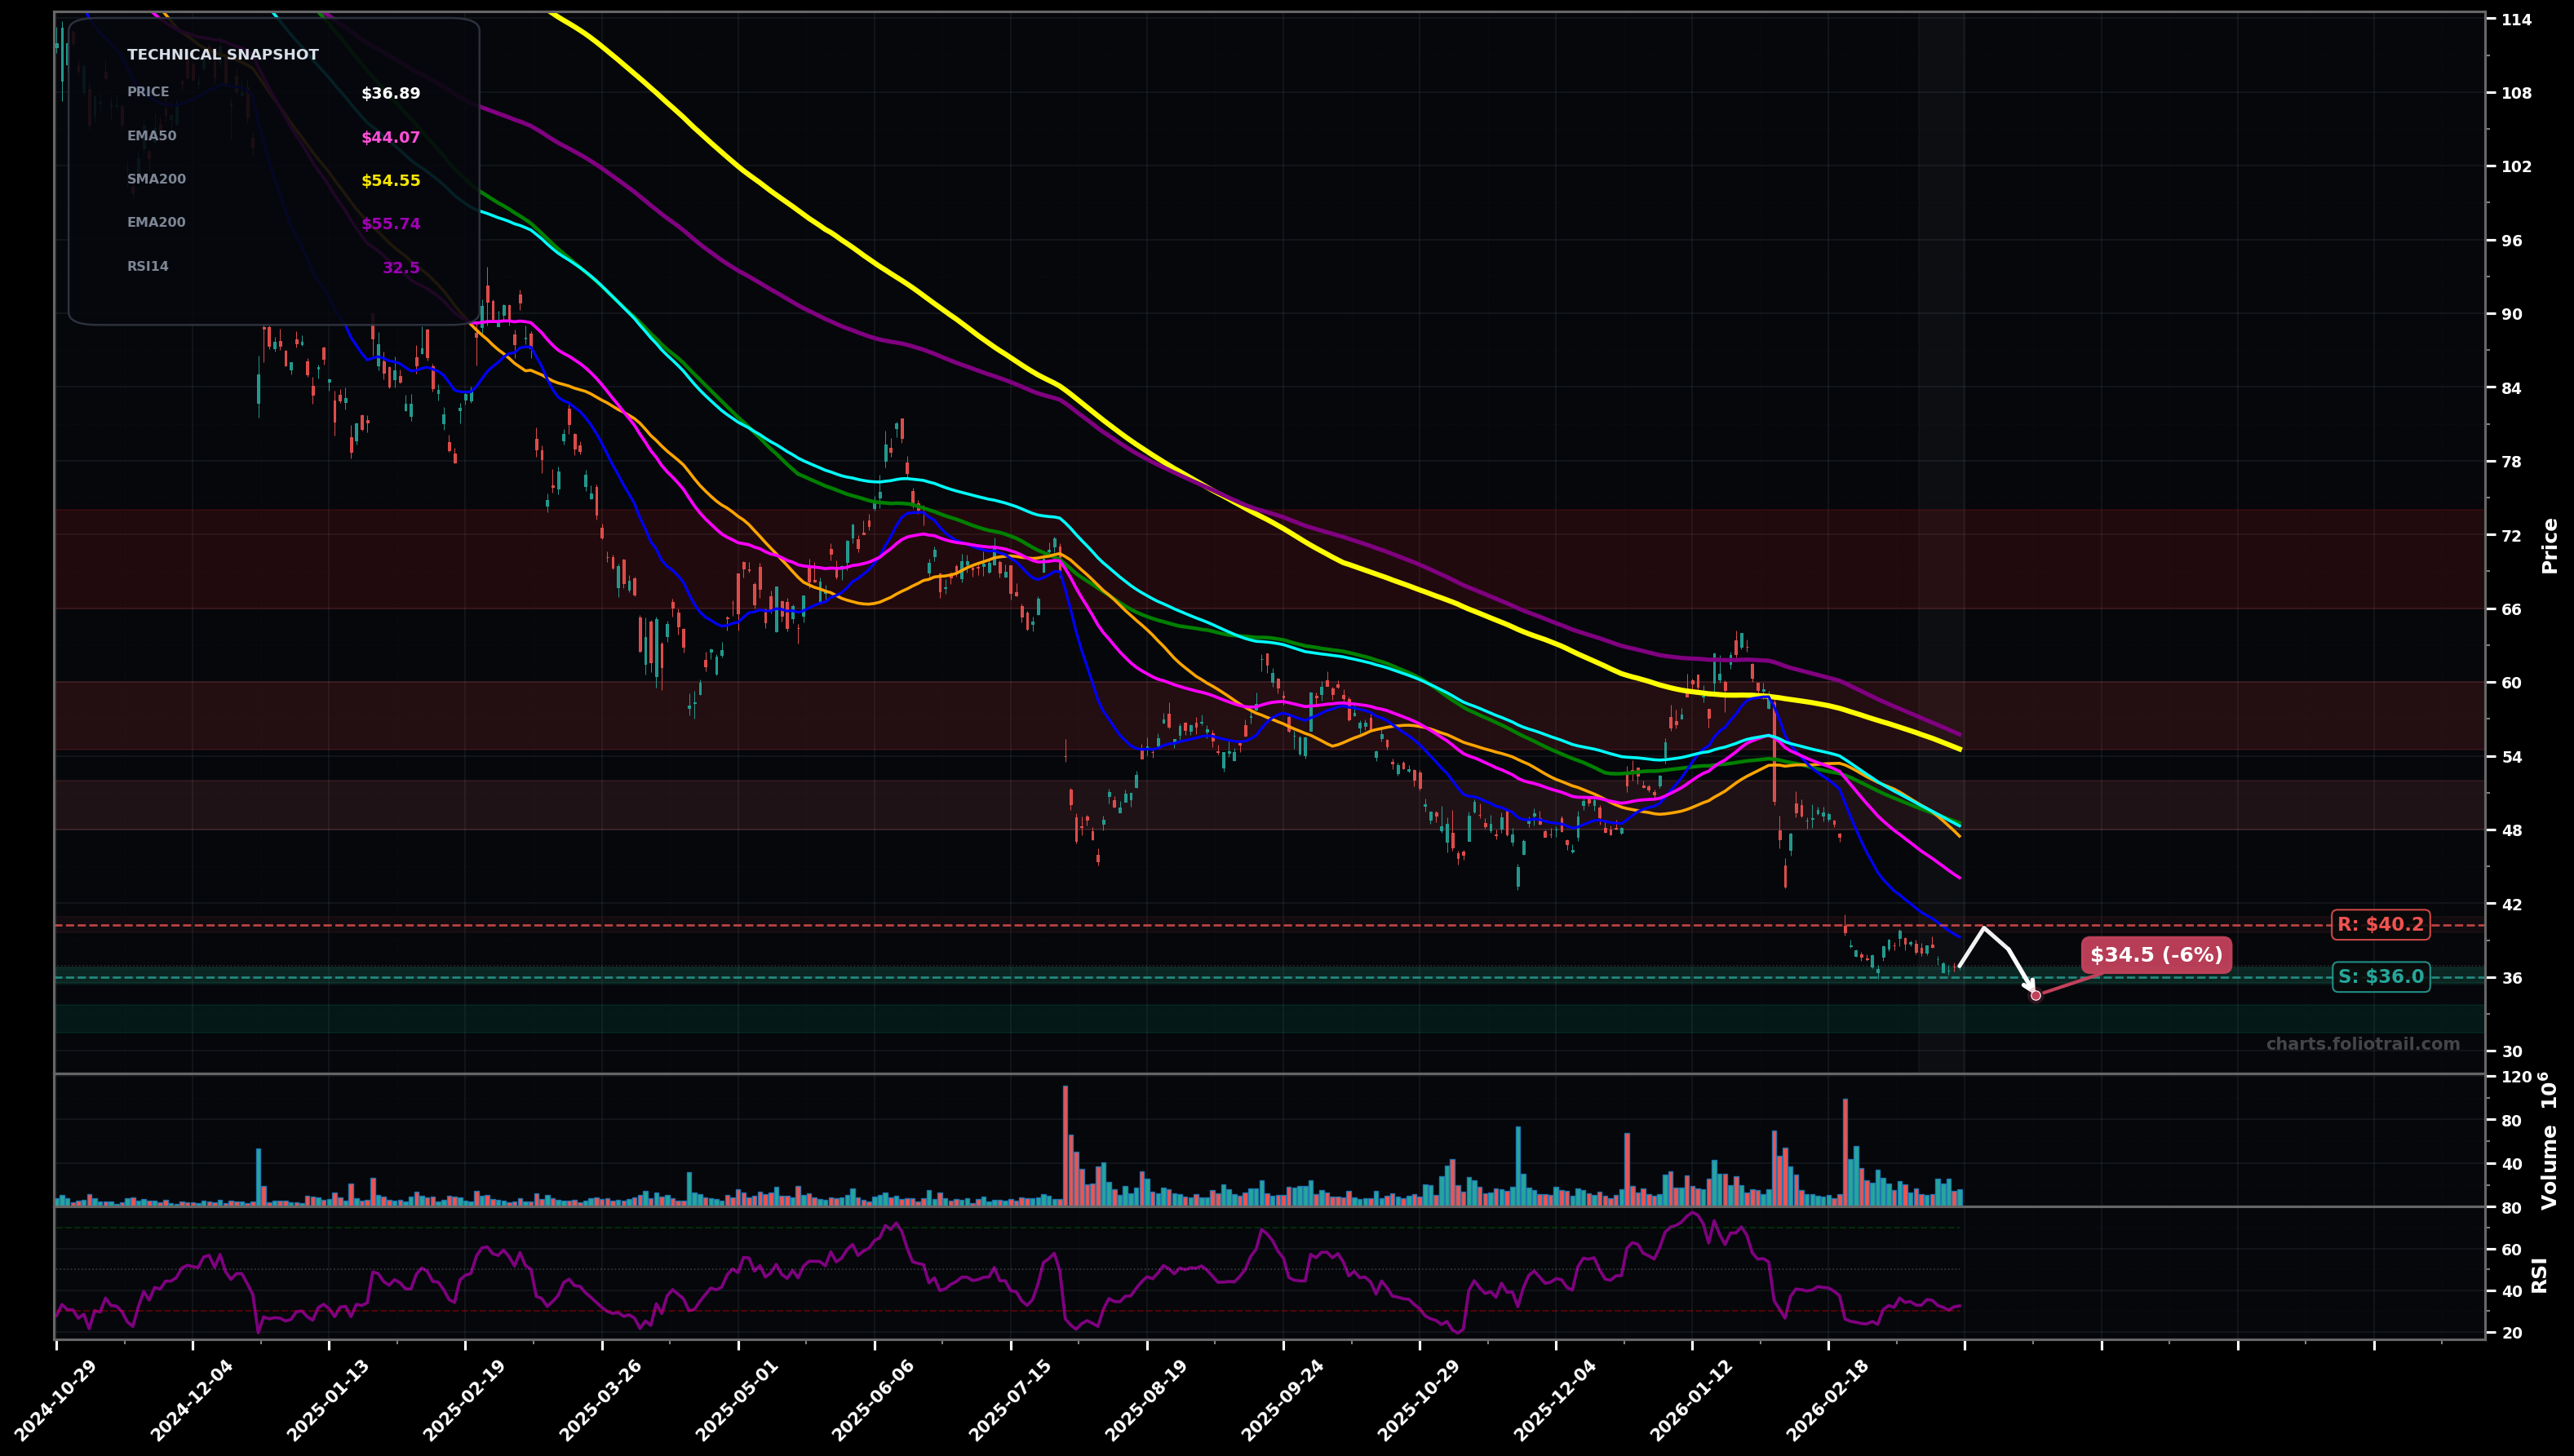
As of May 22, 2026, NVO (Novo Nordisk A/S Sponsored ADR) is in a bottoming attempt state on the daily chart, with a confidence level of 62%. Key support is at $42.9 and key resistance at $46.0. Price at ~$44.96 rebounded from the spring low (~$36) and is pushing into a tight MA cluster (EMA50/EMA100/SMA100/SMA200) with RSI ~58.5 (momentum improving but not overbought).
Base-building continues and price grinds higher: holds above EMA50, breaks the ~$46 MA-supply zone and mean-reverts up toward the next resistance band (prior breakdown area). Rough probability 60%.
Rejection at the ~$46 cluster (SMA200/EMA100 area) leads to a pullback to retest the breakout/basing zone; if that fails, range breaks back down. Rough probability 40%.
Daily close(s) holding above ~$46.00 with follow-through toward ~$49.00
Daily close below ~$40.50 (loss of reclaimed MA support and risk of re-test of the base)
Start/add/heavy-add are mapped to EMA50 support (~$42.95), the prior pivot/support shelf near ~$40, and the major swing-low base near ~$36 for a staged entry if volatility returns.
Trim zones align with likely Fibonacci retrace/overhead supply from the prior downtrend (first into ~$49–$52, then ~$56–$60), with full exit considered into the bigger breakdown/EMA200 region (~$63+).
As of May 22, 2026, NVO (Novo Nordisk A/S Sponsored ADR) is in a bottoming attempt state on the daily chart with 62% confidence. Price at ~$44.96 rebounded from the spring low (~$36) and is pushing into a tight MA cluster (EMA50/EMA100/SMA100/SMA200) with RSI ~58.5 (momentum improving but not overbought).
On the daily timeframe, NVO has key support at $42.9 and key resistance at $46.0. The most likely scenario (bullish) targets $46.0 and $49.1, with a revert level at $44.1.
NVO (Novo Nordisk A/S Sponsored ADR) is currently classified as bottoming attempt on the daily chart, with 62% confidence. Confirmation requires: Daily close(s) holding above ~$46.00 with follow-through toward ~$49.00 This would be invalidated by: Daily close below ~$40.50 (loss of reclaimed MA support and risk of re-test of the base)
The most likely scenario (bullish) targets $46.0 and $49.1, with a revert level at $44.1. The alternative scenario (bearish) targets $42.0 and $36.5.
Multi-layer AI agents analyse 200+ stocks across daily, weekly, and monthly timeframes — producing market state classifications, price scenarios with targets, and position entry/exit levels. Daily charts updated every trading day at 6 PM ET. Weekly charts refresh Fridays. Monthly charts refresh on the last trading day of each month. No paywall. No sign-up required.
Built by Foliotrail.
All content on this website — including charts, analysis, price targets, support/resistance levels, and position zones — is generated entirely by AI and provided for educational and informational purposes only.
This is not financial advice. NEXUSNOIR VENTURES SL (the operator of this website) is not a registered investment adviser or broker-dealer. You should not make investment decisions based solely on this information. Always do your own research and consult a qualified financial advisor.
By continuing, you acknowledge that you have read and agree to our full disclaimer & terms of use and privacy policy.