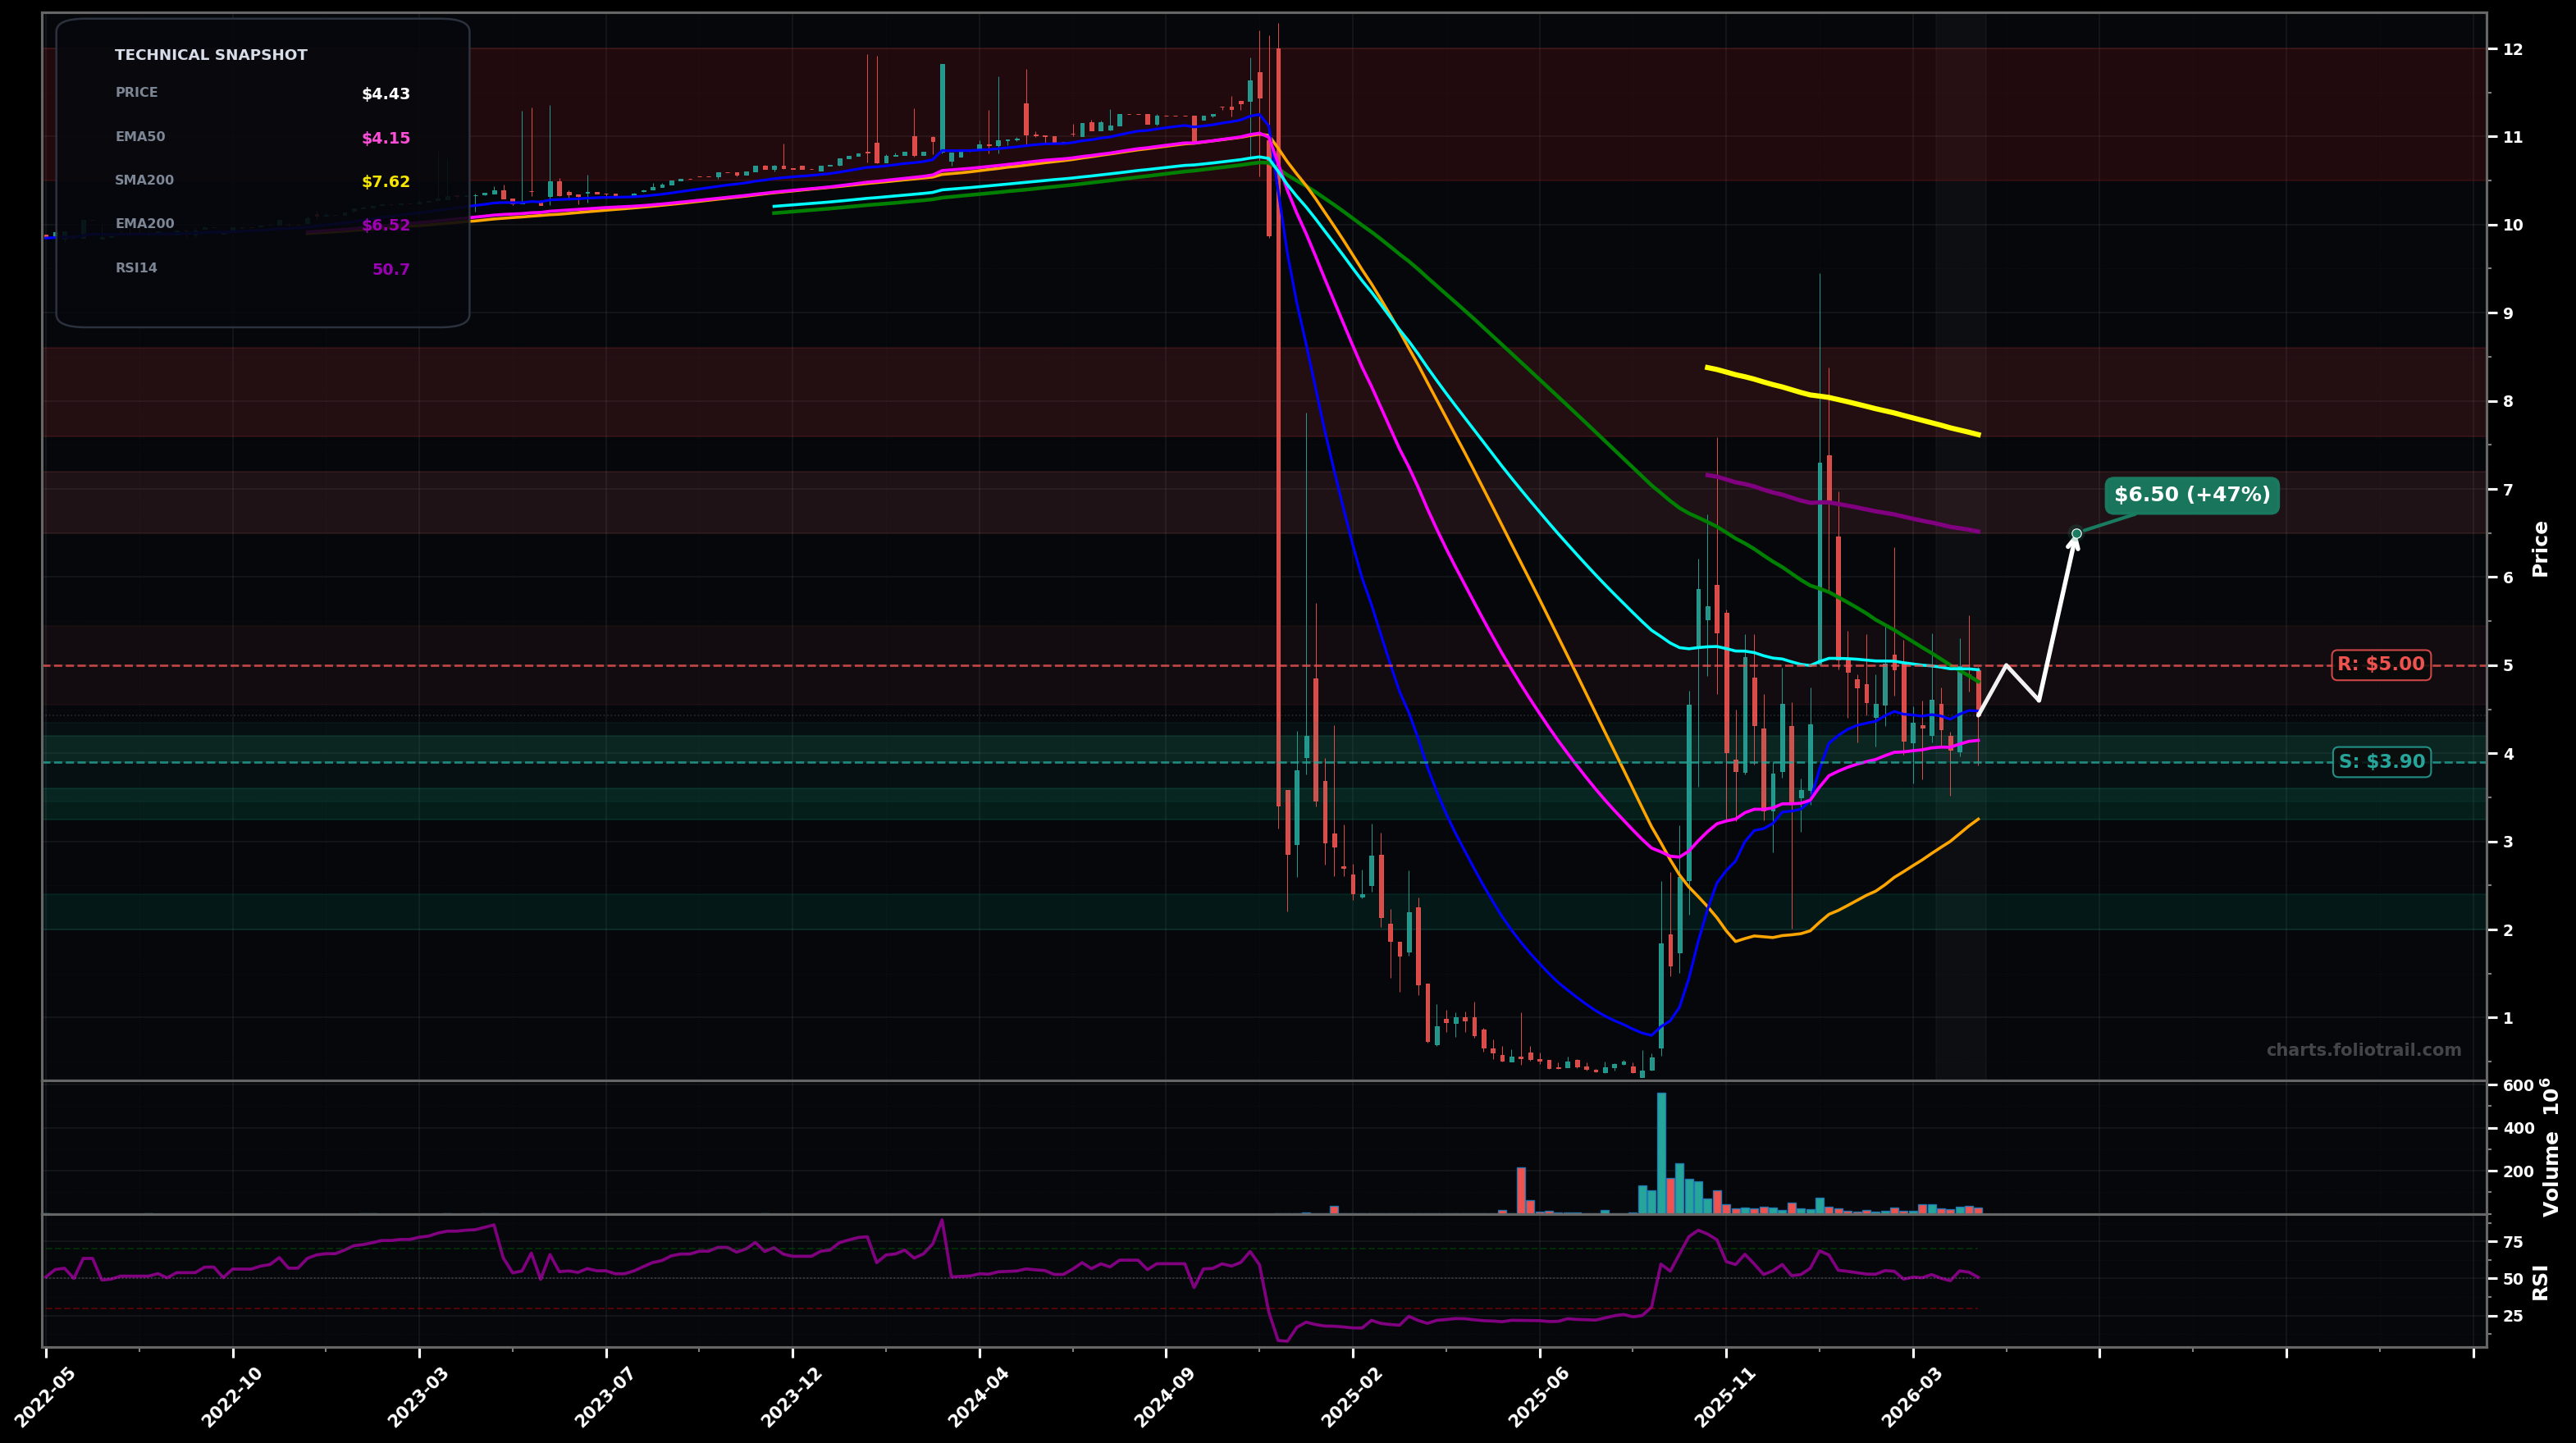
As of May 22, 2026, NUAI (New Era Energy & Digital, Inc.) is in a choppy range state on the weekly chart, with a confidence level of 63%. Key support is at $3.90 and key resistance at $5.00. Price around $4.43 is consolidating after a sharp capitulation drop and a fast rebound; currently holding near the rising/flat EMA50 (~$4.15) but still below EMA100 (~$4.95) and far below EMA200 (~$6.52).
Range resolution to the upside: hold $3.90-$4.15, reclaim EMA100 (~$4.95), then attempt a squeeze toward the bigger overhead MAs/structure (mean reversion after basing). Rough probability: 55%.
Range breaks down: fail to hold $3.90 support, sellers regain control and price mean-reverts back toward the prior post-crash base zone before any durable bottoming. Rough probability: 45%.
Weekly close(s) holding above $4.95 (EMA100) would confirm upside transition out of the range.
Weekly close below $3.90 would invalidate the range and re-open downside risk toward the prior base/lows.
Start near range support/EMA50 area; add at SMA50 (~$3.25) and prior demand; heavy add only on deeper flush toward the post-crash base where risk/reward improves.
Trim into major overhead mean-reversion levels (EMA200 ~$6.52 then SMA200 ~$7.62) and close into the prior distribution/peak zone ($10+), where supply previously overwhelmed demand.
As of May 22, 2026, NUAI (New Era Energy & Digital, Inc.) is in a choppy range state on the weekly chart with 63% confidence. Price around $4.43 is consolidating after a sharp capitulation drop and a fast rebound; currently holding near the rising/flat EMA50 (~$4.15) but still below EMA100 (~$4.95) and far below EMA200 (~$6.52).
On the weekly timeframe, NUAI has key support at $3.90 and key resistance at $5.00. The most likely scenario (bullish) targets $5.00 and $6.50, with a revert level at $4.60.
NUAI (New Era Energy & Digital, Inc.) is currently classified as choppy range on the weekly chart, with 63% confidence. Confirmation requires: Weekly close(s) holding above $4.95 (EMA100) would confirm upside transition out of the range. This would be invalidated by: Weekly close below $3.90 would invalidate the range and re-open downside risk toward the prior base/lows.
The most likely scenario (bullish) targets $5.00 and $6.50, with a revert level at $4.60. The alternative scenario (bearish) targets $3.25 and $2.00.
Multi-layer AI agents analyse 200+ stocks across daily, weekly, and monthly timeframes — producing market state classifications, price scenarios with targets, and position entry/exit levels. Daily charts updated every trading day at 6 PM ET. Weekly charts refresh Fridays. Monthly charts refresh on the last trading day of each month. No paywall. No sign-up required.
Built by Foliotrail.
All content on this website — including charts, analysis, price targets, support/resistance levels, and position zones — is generated entirely by AI and provided for educational and informational purposes only.
This is not financial advice. NEXUSNOIR VENTURES SL (the operator of this website) is not a registered investment adviser or broker-dealer. You should not make investment decisions based solely on this information. Always do your own research and consult a qualified financial advisor.
By continuing, you acknowledge that you have read and agree to our full disclaimer & terms of use and privacy policy.