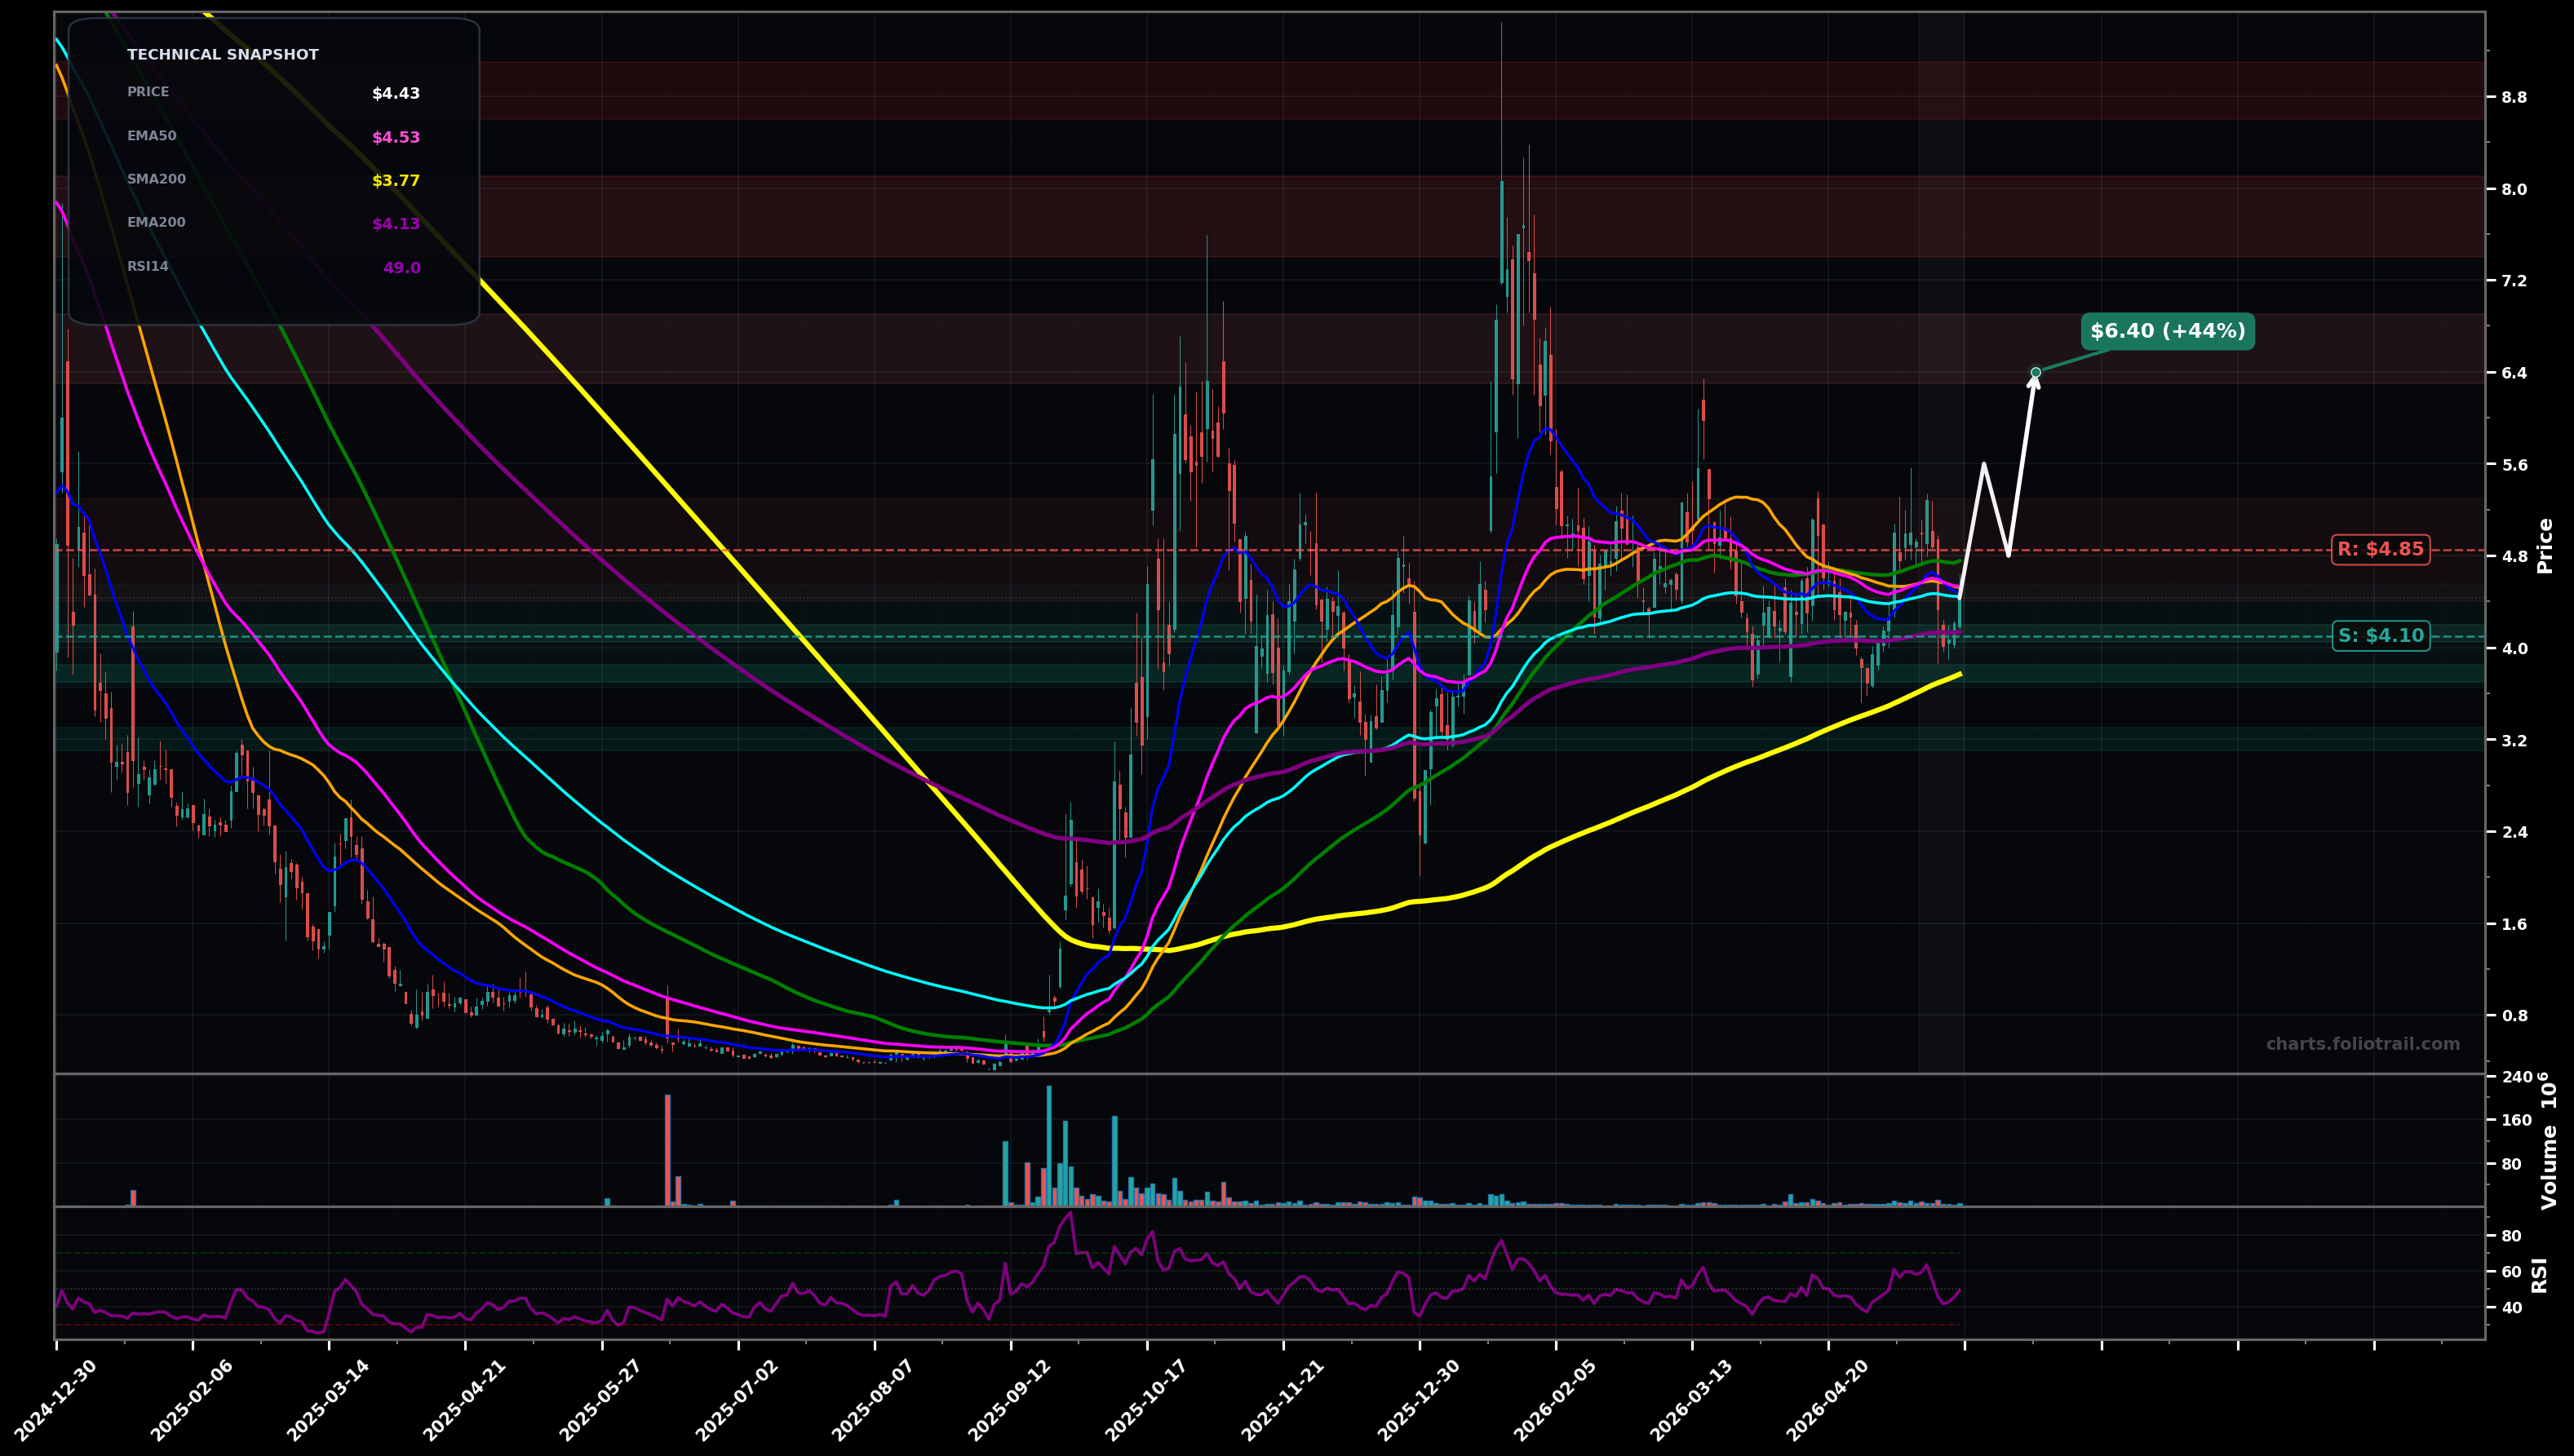
As of May 22, 2026, NUAI (New Era Energy & Digital, Inc.) is in a choppy range state on the daily chart, with a confidence level of 68%. Key support is at $4.10 and key resistance at $4.85. Price around $4.43 is compressing in a tight range, sitting near EMA50 ($4.53) / EMA100 ($4.44) with RSI14 ~49 after prior spike-and-cooloff; no clean HH/HL or LH/LL lately.
Range resolves upward: reclaim/hold above the $4.85 supply zone, then a rotation toward prior breakdown areas; typical post-base push aligns with an Elliott Wave view of a corrective wave (4) finishing and starting a wave (5) attempt.
Range breaks down: lose $4.10 support/EMA200 and drift into a deeper mean-reversion toward the rising long-term base; this would fit an Elliott corrective leg (C) or a larger degree wave (2)/(4) extension before any next impulse.
2+ daily closes above $4.85 with EMA50 turning up
Daily close below $4.05 (loss of range support and EMA200 ~$4.13)
Starter near range floor/EMA200 support; add on breakdown into prior pivot demand; heavy add at deeper support where downside likely exhausts and R:R improves.
Trim into prior spike supply zones (Jan–Feb highs) where extensions typically stall; higher trims/exit near the blow-off wick area where long-term upside becomes most stretched.
As of May 22, 2026, NUAI (New Era Energy & Digital, Inc.) is in a choppy range state on the daily chart with 68% confidence. Price around $4.43 is compressing in a tight range, sitting near EMA50 ($4.53) / EMA100 ($4.44) with RSI14 ~49 after prior spike-and-cooloff; no clean HH/HL or LH/LL lately.
On the daily timeframe, NUAI has key support at $4.10 and key resistance at $4.85. The most likely scenario (bullish) targets $5.60 and $6.40, with a revert level at $4.80.
NUAI (New Era Energy & Digital, Inc.) is currently classified as choppy range on the daily chart, with 68% confidence. Confirmation requires: 2+ daily closes above $4.85 with EMA50 turning up This would be invalidated by: Daily close below $4.05 (loss of range support and EMA200 ~$4.13)
The most likely scenario (bullish) targets $5.60 and $6.40, with a revert level at $4.80. The alternative scenario (bearish) targets $3.75 and $3.20.
Multi-layer AI agents analyse 200+ stocks across daily, weekly, and monthly timeframes — producing market state classifications, price scenarios with targets, and position entry/exit levels. Daily charts updated every trading day at 6 PM ET. Weekly charts refresh Fridays. Monthly charts refresh on the last trading day of each month. No paywall. No sign-up required.
Built by Foliotrail.
All content on this website — including charts, analysis, price targets, support/resistance levels, and position zones — is generated entirely by AI and provided for educational and informational purposes only.
This is not financial advice. NEXUSNOIR VENTURES SL (the operator of this website) is not a registered investment adviser or broker-dealer. You should not make investment decisions based solely on this information. Always do your own research and consult a qualified financial advisor.
By continuing, you acknowledge that you have read and agree to our full disclaimer & terms of use and privacy policy.