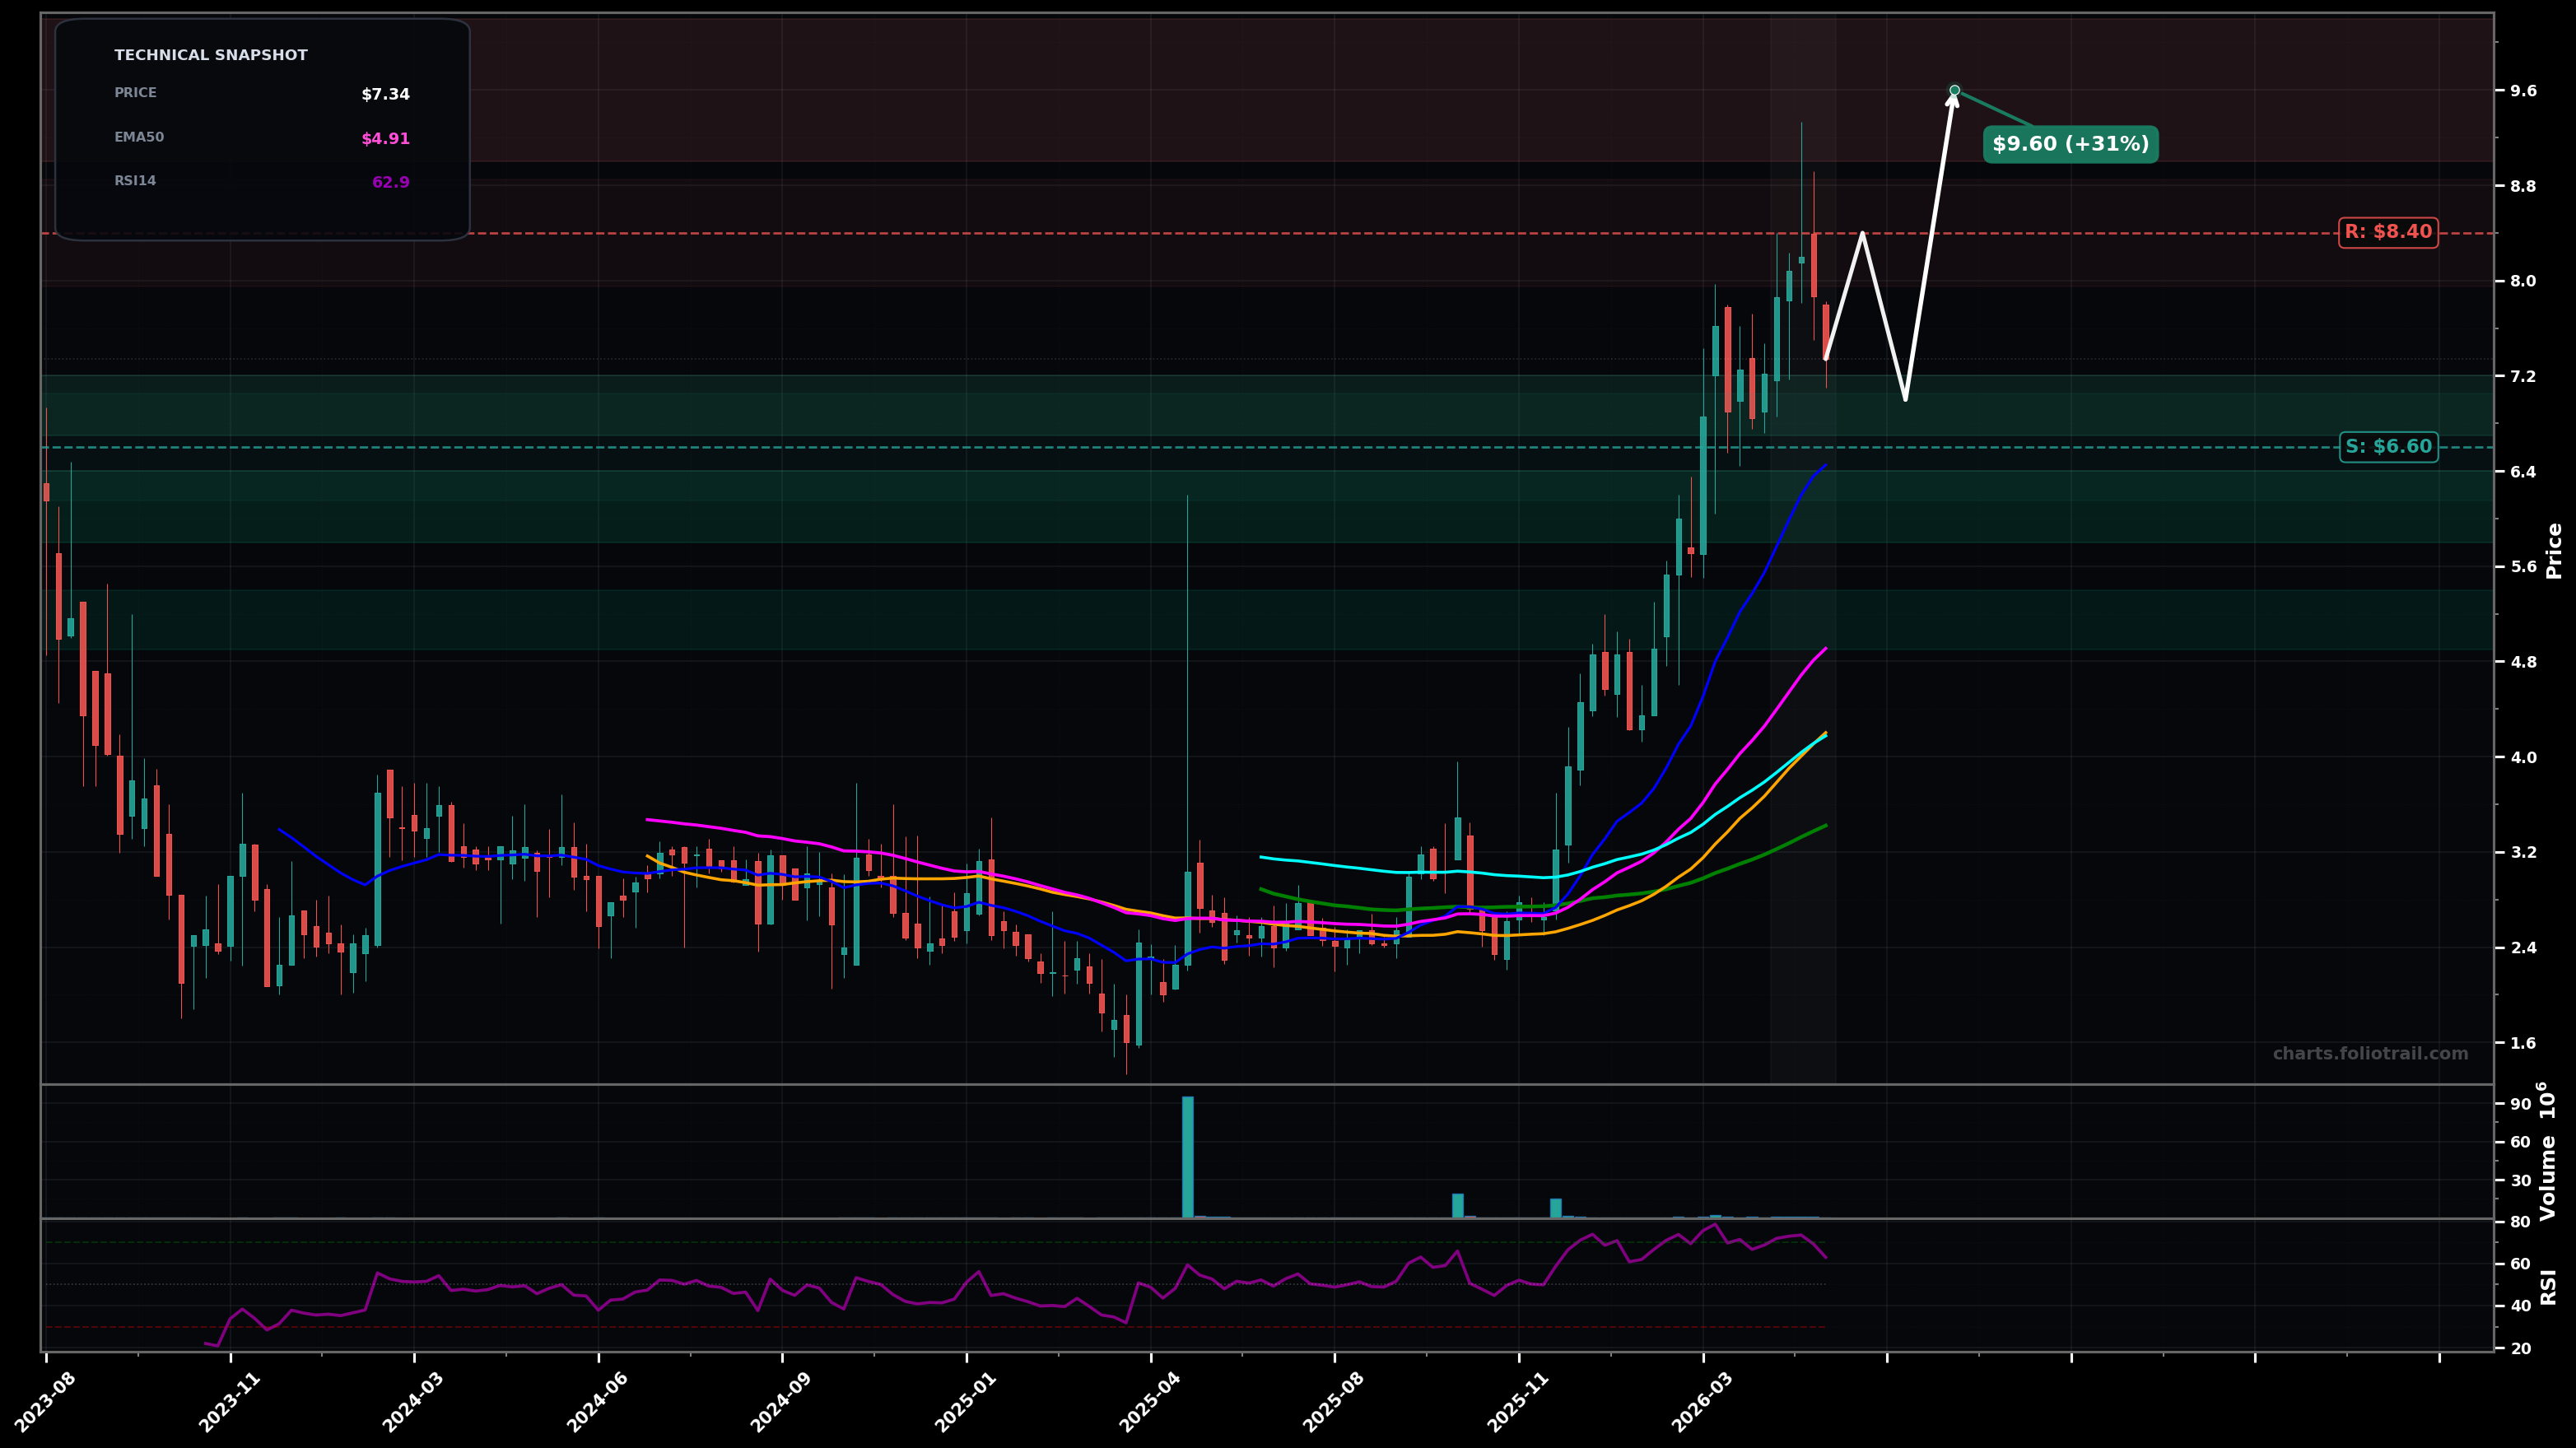
As of May 22, 2026, NRXS (Neuraxis Inc.) is in a uptrend state on the weekly chart, with a confidence level of 72%. Key support is at $6.60 and key resistance at $8.40. Strong impulsive run from the late-2025 base into $8-$9, followed by a sharp pullback to ~$7.34 while still holding above the rising EMA50 (~$4.91); RSI14 ~63 cooling from near-overbought.
Bullish continuation after a controlled pullback: price bases between ~$6.6-$7.4, then retests the prior high zone and extends (Elliott: wave 4 consolidation then wave 5 push; Fib: shallow 23.6% retrace favored given strong momentum).
Deeper correction before any new highs: a weekly close under ~$6.6 triggers an ABC-style retrace toward the breakout/MA confluence (Fib: ~38.2%-50% zone) with buyers likely defending the prior base area and rising EMA50/EMA100 structure.
Weekly close back above $8.40 with follow-through (next close holding >$8.40).
Weekly close below $6.60 (break of the most recent swing low area, risking a deeper ABC).
Start near swing-low support; add on deeper Fib retrace toward prior breakout shelf; heavy add at EMA50 (~$4.91) / prior base confluence if trend structure is still intact.
Trim into extensions above prior highs where wave-5/extension risk rises; increase derisk at larger Fib extensions; fully close if price becomes extremely stretched versus rising MAs and prior cycle resistance.
As of May 22, 2026, NRXS (Neuraxis Inc.) is in a uptrend state on the weekly chart with 72% confidence. Strong impulsive run from the late-2025 base into $8-$9, followed by a sharp pullback to ~$7.34 while still holding above the rising EMA50 (~$4.91); RSI14 ~63 cooling from near-overbought.
On the weekly timeframe, NRXS has key support at $6.60 and key resistance at $8.40. The most likely scenario (bullish) targets $8.40 and $9.60, with a revert level at $7.00.
NRXS (Neuraxis Inc.) is currently classified as uptrend on the weekly chart, with 72% confidence. Confirmation requires: Weekly close back above $8.40 with follow-through (next close holding >$8.40). This would be invalidated by: Weekly close below $6.60 (break of the most recent swing low area, risking a deeper ABC).
The most likely scenario (bullish) targets $8.40 and $9.60, with a revert level at $7.00. The alternative scenario (bearish) targets $5.60 and $4.90.
Multi-layer AI agents analyse 200+ stocks across daily, weekly, and monthly timeframes — producing market state classifications, price scenarios with targets, and position entry/exit levels. Daily charts updated every trading day at 6 PM ET. Weekly charts refresh Fridays. Monthly charts refresh on the last trading day of each month. No paywall. No sign-up required.
Built by Foliotrail.
All content on this website — including charts, analysis, price targets, support/resistance levels, and position zones — is generated entirely by AI and provided for educational and informational purposes only.
This is not financial advice. NEXUSNOIR VENTURES SL (the operator of this website) is not a registered investment adviser or broker-dealer. You should not make investment decisions based solely on this information. Always do your own research and consult a qualified financial advisor.
By continuing, you acknowledge that you have read and agree to our full disclaimer & terms of use and privacy policy.