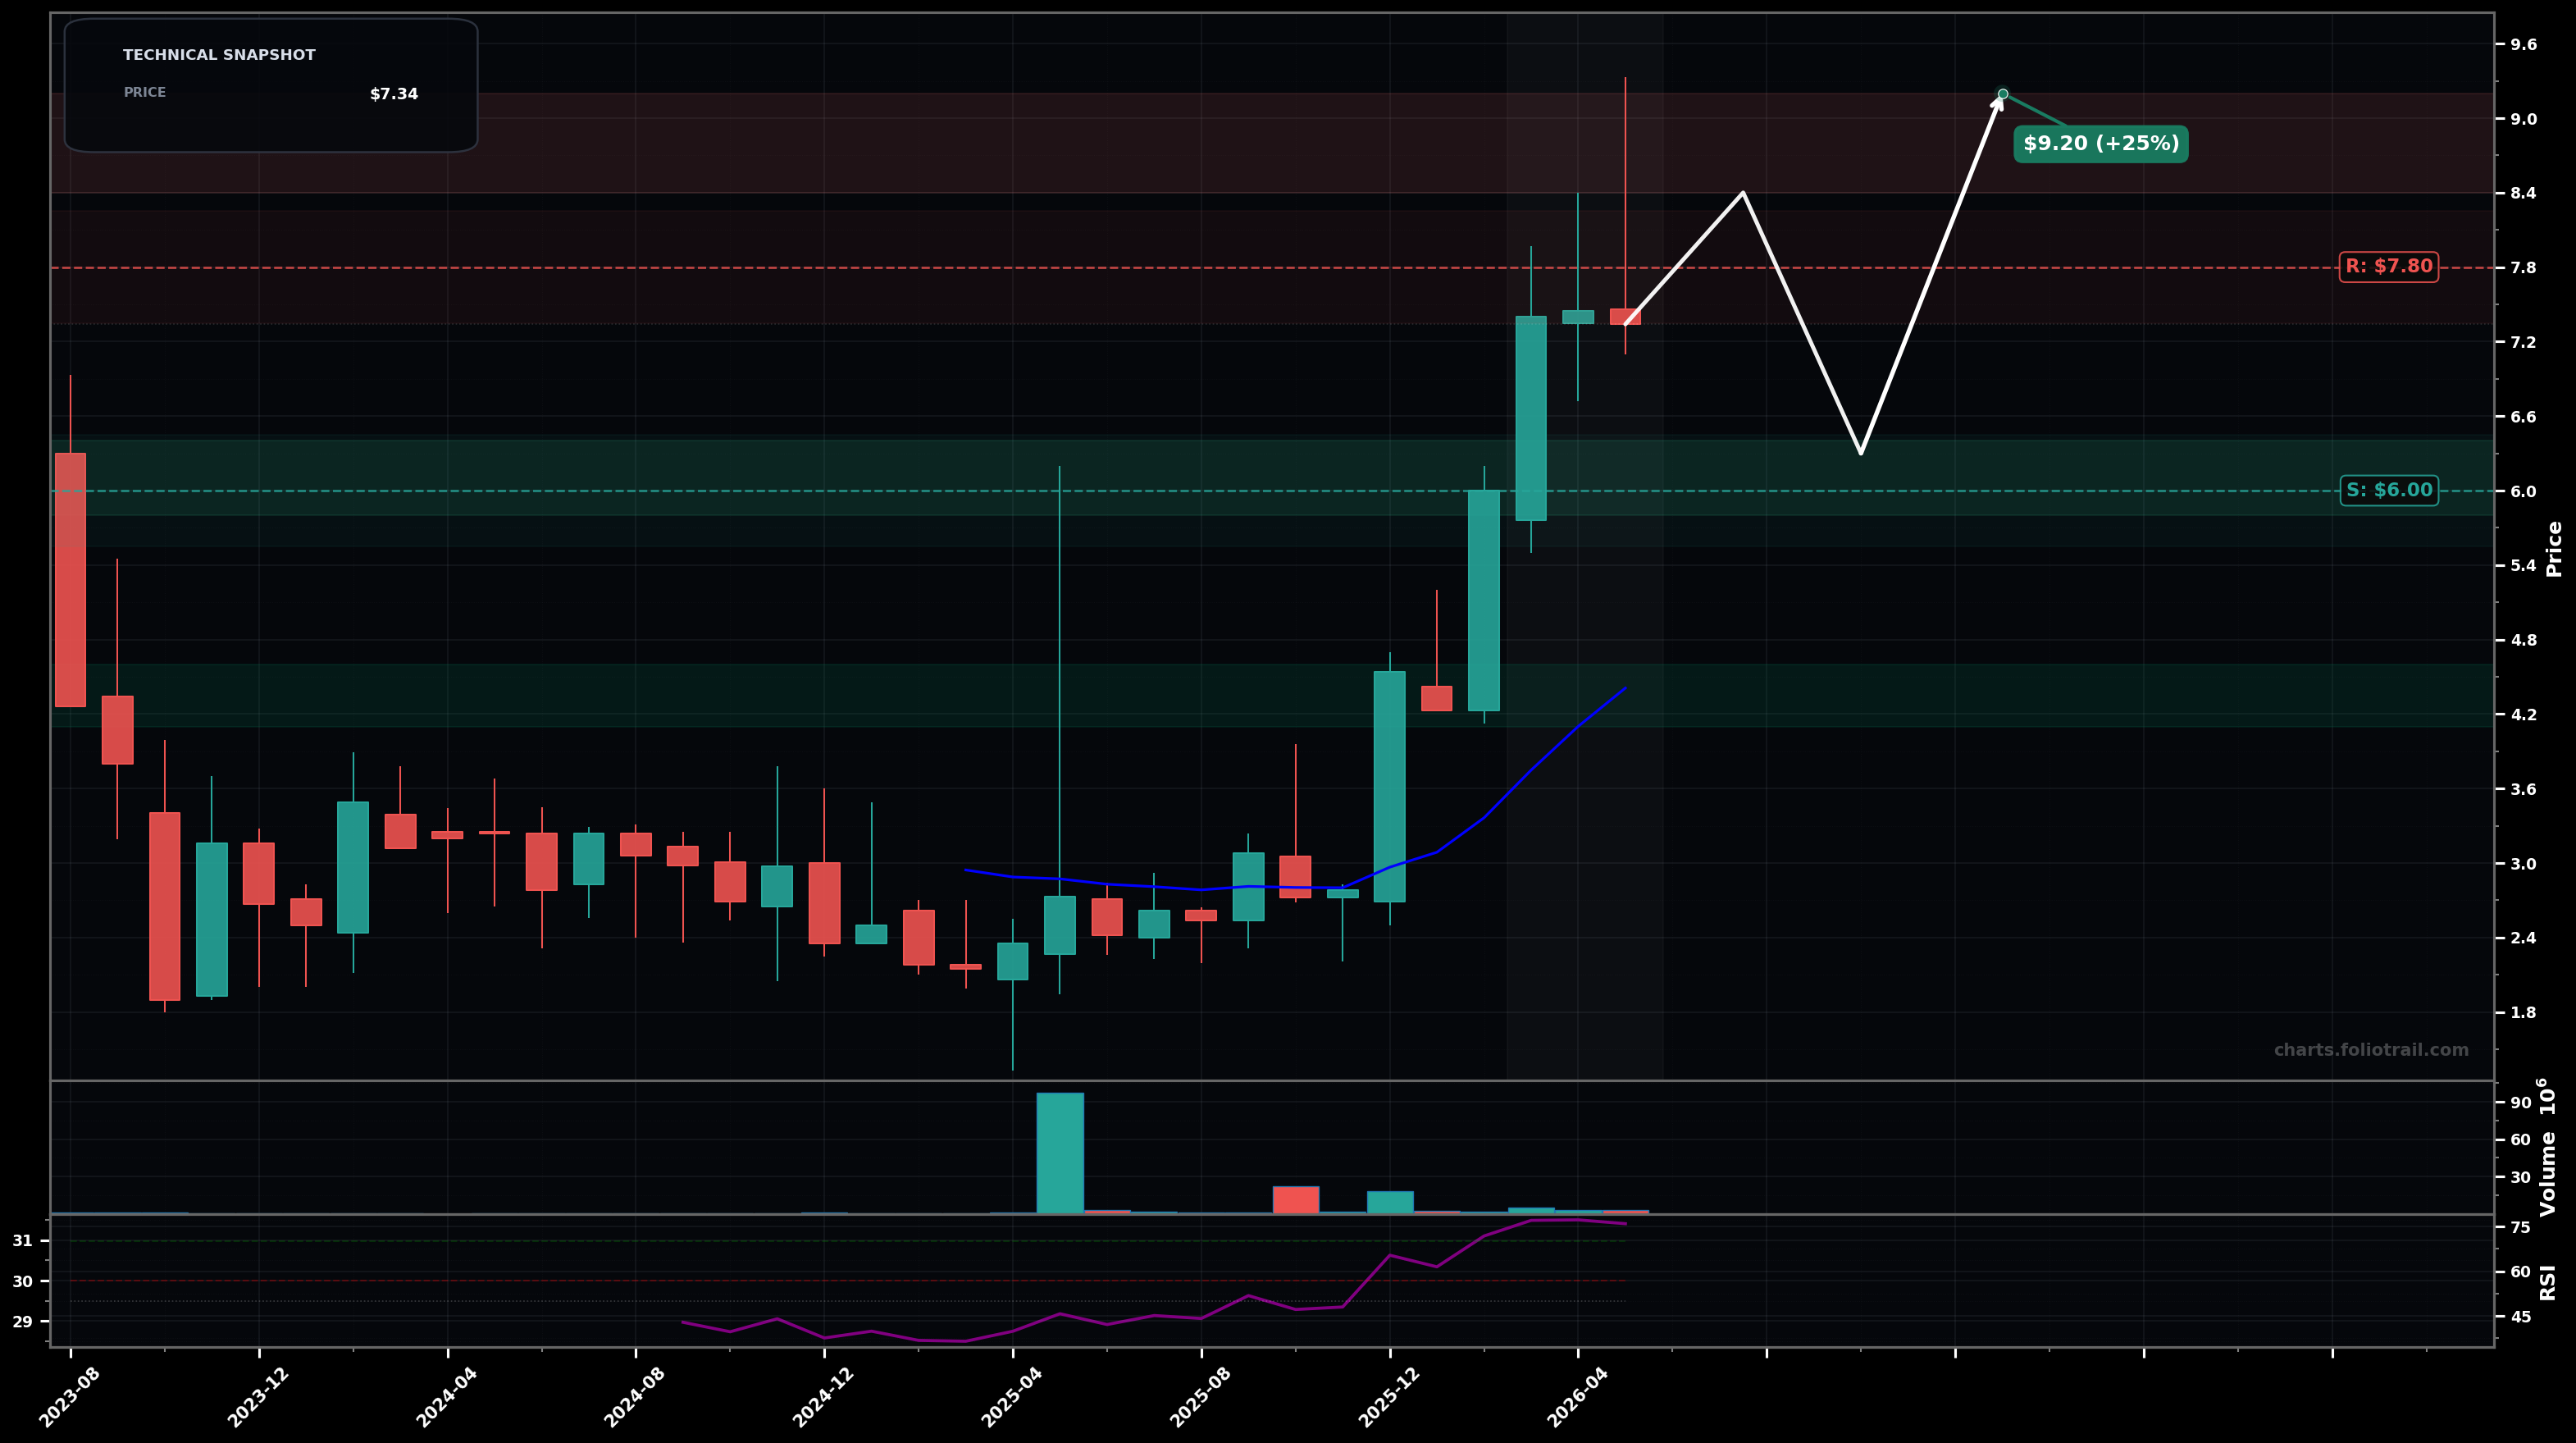
As of May 22, 2026, NRXS (Neuraxis Inc.) is in a parabolic state on the monthly chart, with a confidence level of 67%. Key support is at $6.00 and key resistance at $7.80. Monthly breakout run from a long base, followed by a small pause/pullback near the highs; price ~$7.34 with RSI-14 ~76 (overbought) and well above the rising EMA20 (~$4.41).
Bullish continuation but with digestion: price ranges/pulls back to retest the breakout zone ($6.00-$6.40), then attempts another leg higher toward the prior spike/high area; Elliott read: likely Wave 3 extension already occurred and this is Wave 4 consolidation before a Wave 5 push.
Deeper mean reversion: after an overbought peak (RSI), price unwinds back toward the rising EMA20 and prior base top; Elliott read: ABC corrective into the $4-$5 zone before trend decision.
Monthly close above $7.80 with follow-through (next month holds above $7.20).
Monthly close below $5.80 (breaks the breakout structure and signals deeper mean reversion).
Start on first breakout retest ($6 area), add on deeper pullback toward prior structure, heavy-add near EMA20/old base top (~$4.4) where risk/reward improves if trend remains intact.
Trim into upside extensions (probable Wave 5 / fib-extension zone) because monthly is already overbought and stretched vs EMA; progressively de-risk as price moves further above prior resistance and becomes harder to sustain.
As of May 22, 2026, NRXS (Neuraxis Inc.) is in a parabolic state on the monthly chart with 67% confidence. Monthly breakout run from a long base, followed by a small pause/pullback near the highs; price ~$7.34 with RSI-14 ~76 (overbought) and well above the rising EMA20 (~$4.41).
On the monthly timeframe, NRXS has key support at $6.00 and key resistance at $7.80. The most likely scenario (bullish) targets $8.40 and $9.20, with a revert level at $6.30.
NRXS (Neuraxis Inc.) is currently classified as parabolic on the monthly chart, with 67% confidence. Confirmation requires: Monthly close above $7.80 with follow-through (next month holds above $7.20). This would be invalidated by: Monthly close below $5.80 (breaks the breakout structure and signals deeper mean reversion).
The most likely scenario (bullish) targets $8.40 and $9.20, with a revert level at $6.30. The alternative scenario (bearish) targets $5.20 and $4.40.
Multi-layer AI agents analyse 200+ stocks across daily, weekly, and monthly timeframes — producing market state classifications, price scenarios with targets, and position entry/exit levels. Daily charts updated every trading day at 6 PM ET. Weekly charts refresh Fridays. Monthly charts refresh on the last trading day of each month. No paywall. No sign-up required.
Built by Foliotrail.
All content on this website — including charts, analysis, price targets, support/resistance levels, and position zones — is generated entirely by AI and provided for educational and informational purposes only.
This is not financial advice. NEXUSNOIR VENTURES SL (the operator of this website) is not a registered investment adviser or broker-dealer. You should not make investment decisions based solely on this information. Always do your own research and consult a qualified financial advisor.
By continuing, you acknowledge that you have read and agree to our full disclaimer & terms of use and privacy policy.