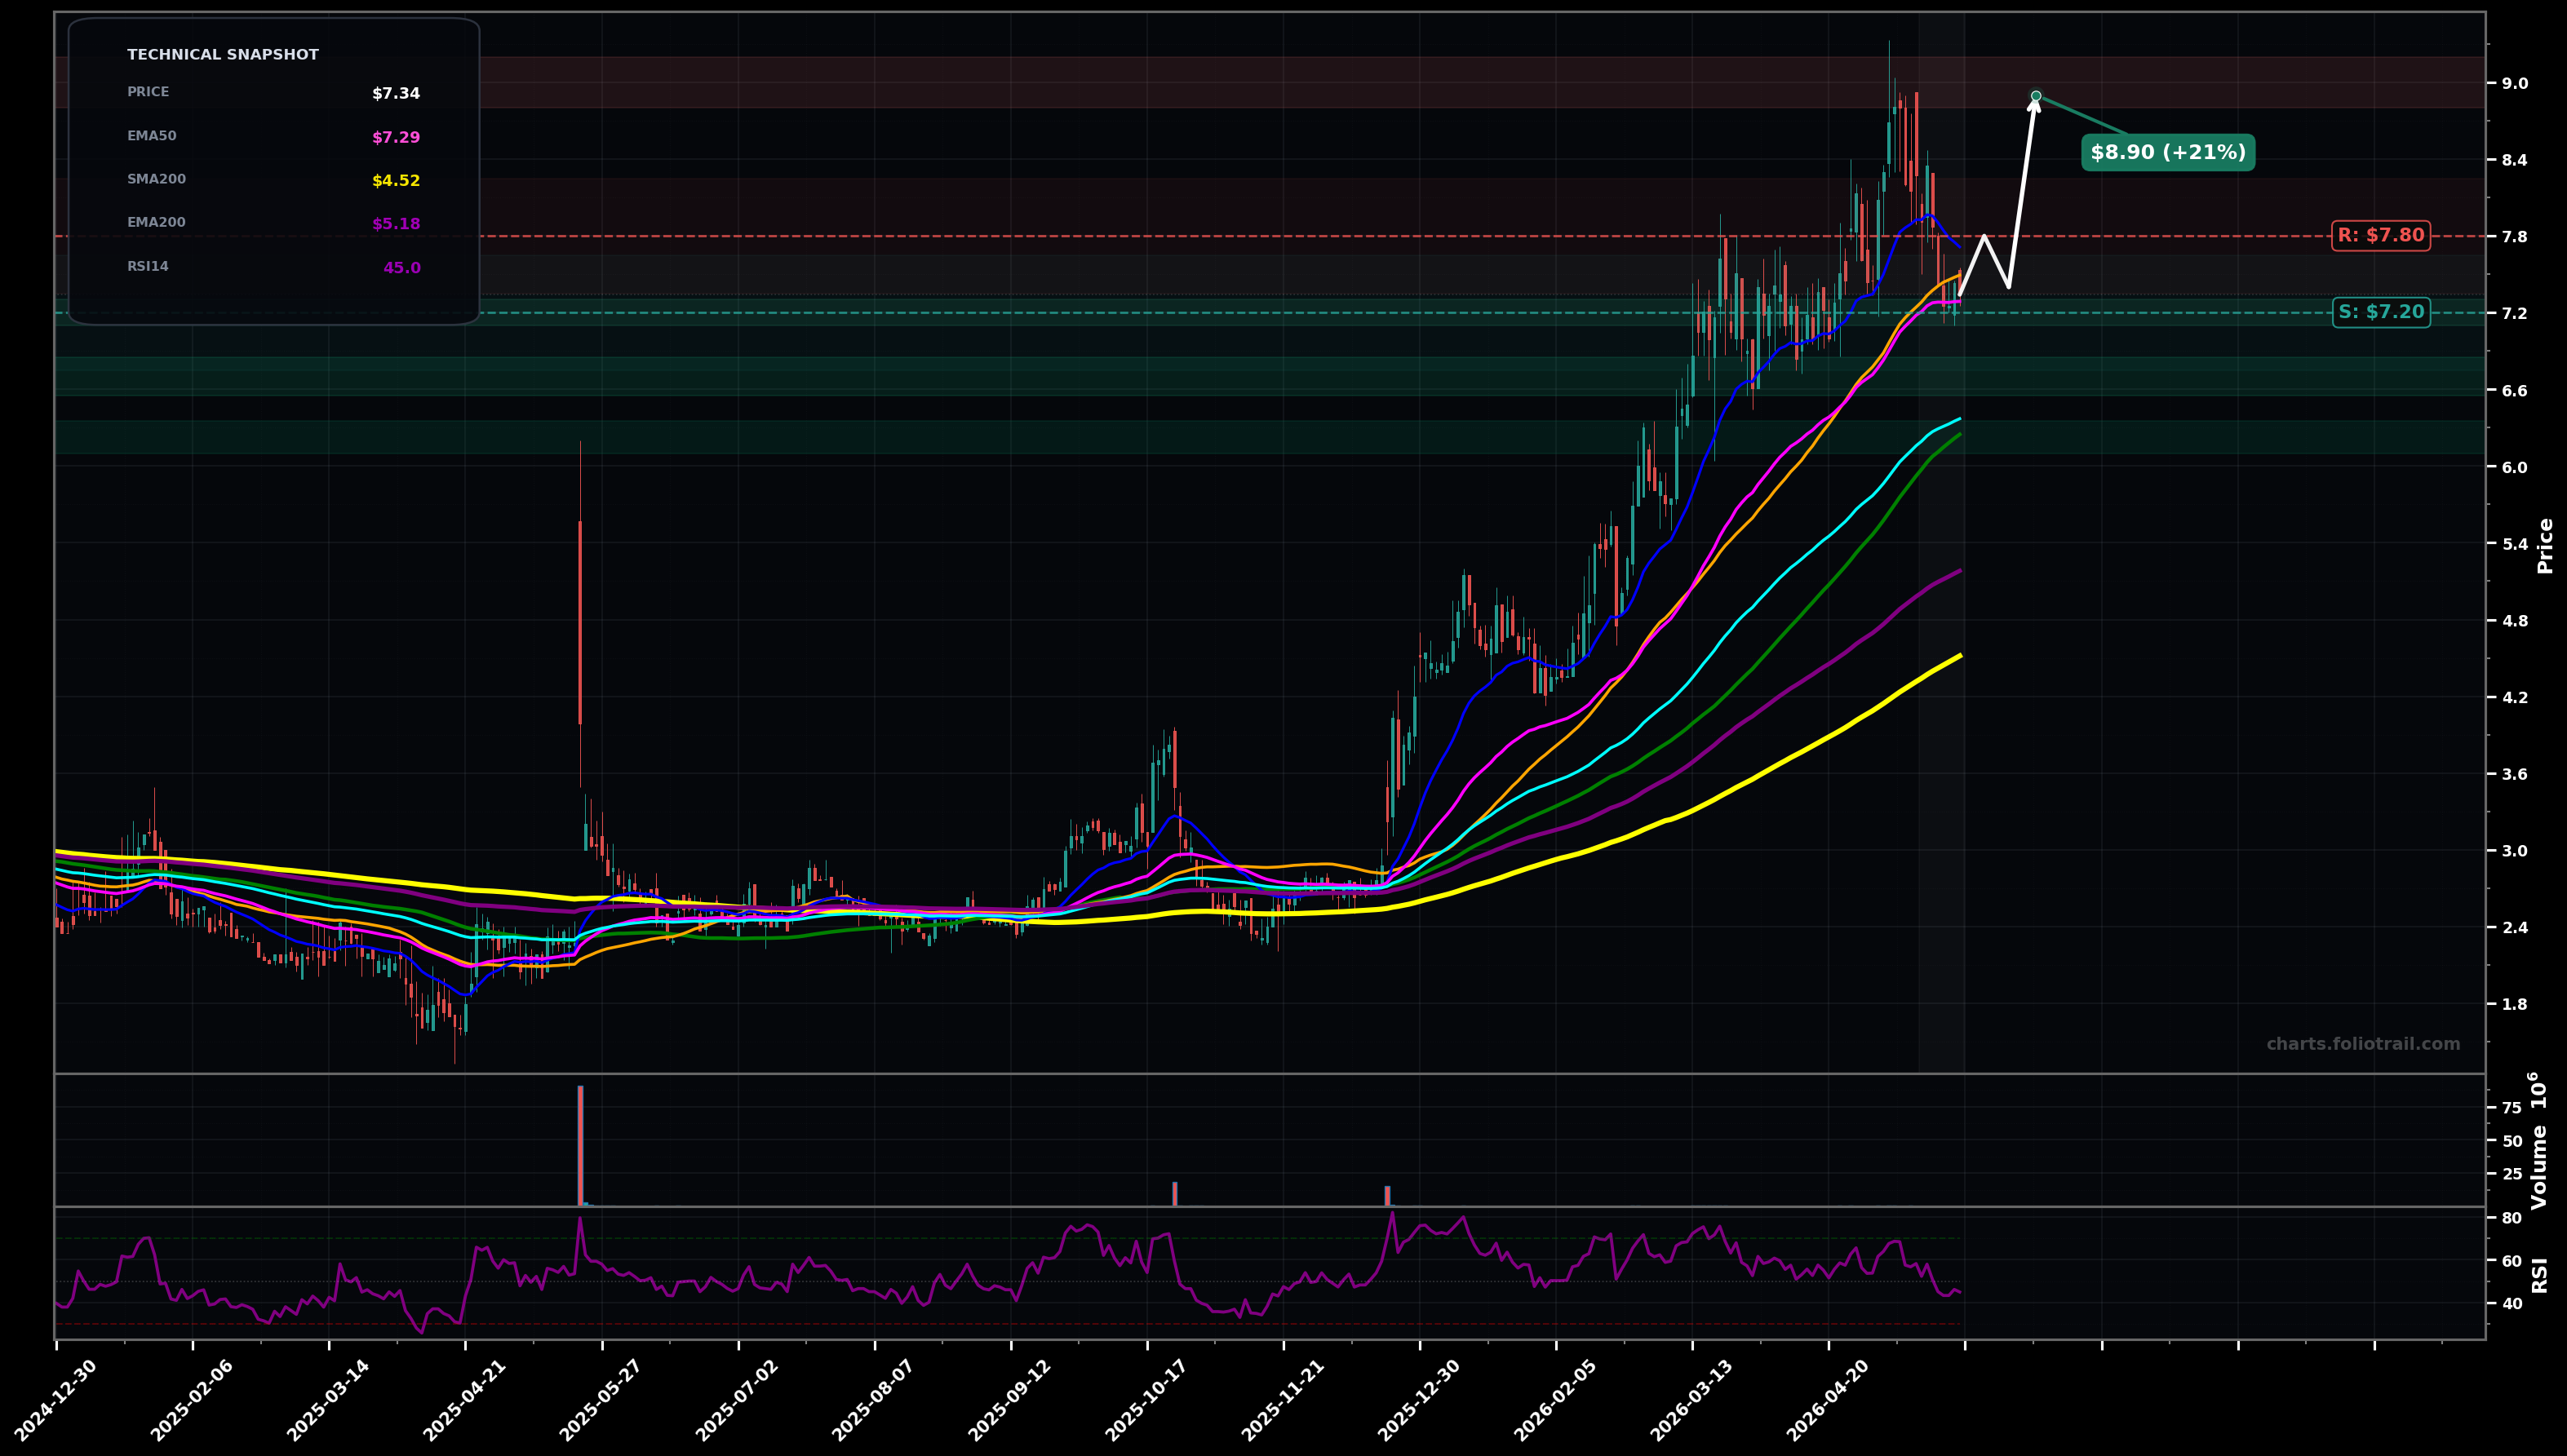
As of May 22, 2026, NRXS (Neuraxis Inc.) is in a choppy range state on the daily chart, with a confidence level of 62%. Key support is at $7.20 and key resistance at $7.80. After a strong advance to ~$9, price pulled back to ~$7.34 and is now sitting near the EMA50 (~$7.29) while still above EMA100 (~$6.37); RSI-14 ~45 shows momentum cooling.
Range resolves up: holds ~$7.20 support, reclaims ~$7.80, and attempts a retest of the prior swing high; Elliott view: likely Wave (4) consolidation completing, setting up Wave (5) attempt; Fib: typical pullback holding in the 38.2–50% zone of the most recent impulse.
Range breaks down: loses EMA50 and slips toward EMA100/SMA100 area; Elliott view: Wave (4) deepens into a larger ABC before any next push; Fib risk: move toward a deeper ~61.8% retrace of the last leg up.
2+ daily closes back above $7.80
Daily close below $6.95
Start near current support/EMA50, add into EMA100/SMA100 confluence, heavy add on deeper retrace into prior breakout/MA cluster if structure stabilizes (HL/undercut-and-rally).
Trim into prior swing-high supply (~$9) and potential extension levels; heavier trims on clear price-extension above prior peak; full exit only if a multi-year-style overshoot/mania extension occurs.
As of May 22, 2026, NRXS (Neuraxis Inc.) is in a choppy range state on the daily chart with 62% confidence. After a strong advance to ~$9, price pulled back to ~$7.34 and is now sitting near the EMA50 (~$7.29) while still above EMA100 (~$6.37); RSI-14 ~45 shows momentum cooling.
On the daily timeframe, NRXS has key support at $7.20 and key resistance at $7.80. The most likely scenario (bullish) targets $7.80 and $8.90, with a revert level at $7.40.
NRXS (Neuraxis Inc.) is currently classified as choppy range on the daily chart, with 62% confidence. Confirmation requires: 2+ daily closes back above $7.80 This would be invalidated by: Daily close below $6.95
The most likely scenario (bullish) targets $7.80 and $8.90, with a revert level at $7.40. The alternative scenario (bearish) targets $6.70 and $6.25.
Multi-layer AI agents analyse 200+ stocks across daily, weekly, and monthly timeframes — producing market state classifications, price scenarios with targets, and position entry/exit levels. Daily charts updated every trading day at 6 PM ET. Weekly charts refresh Fridays. Monthly charts refresh on the last trading day of each month. No paywall. No sign-up required.
Built by Foliotrail.
All content on this website — including charts, analysis, price targets, support/resistance levels, and position zones — is generated entirely by AI and provided for educational and informational purposes only.
This is not financial advice. NEXUSNOIR VENTURES SL (the operator of this website) is not a registered investment adviser or broker-dealer. You should not make investment decisions based solely on this information. Always do your own research and consult a qualified financial advisor.
By continuing, you acknowledge that you have read and agree to our full disclaimer & terms of use and privacy policy.