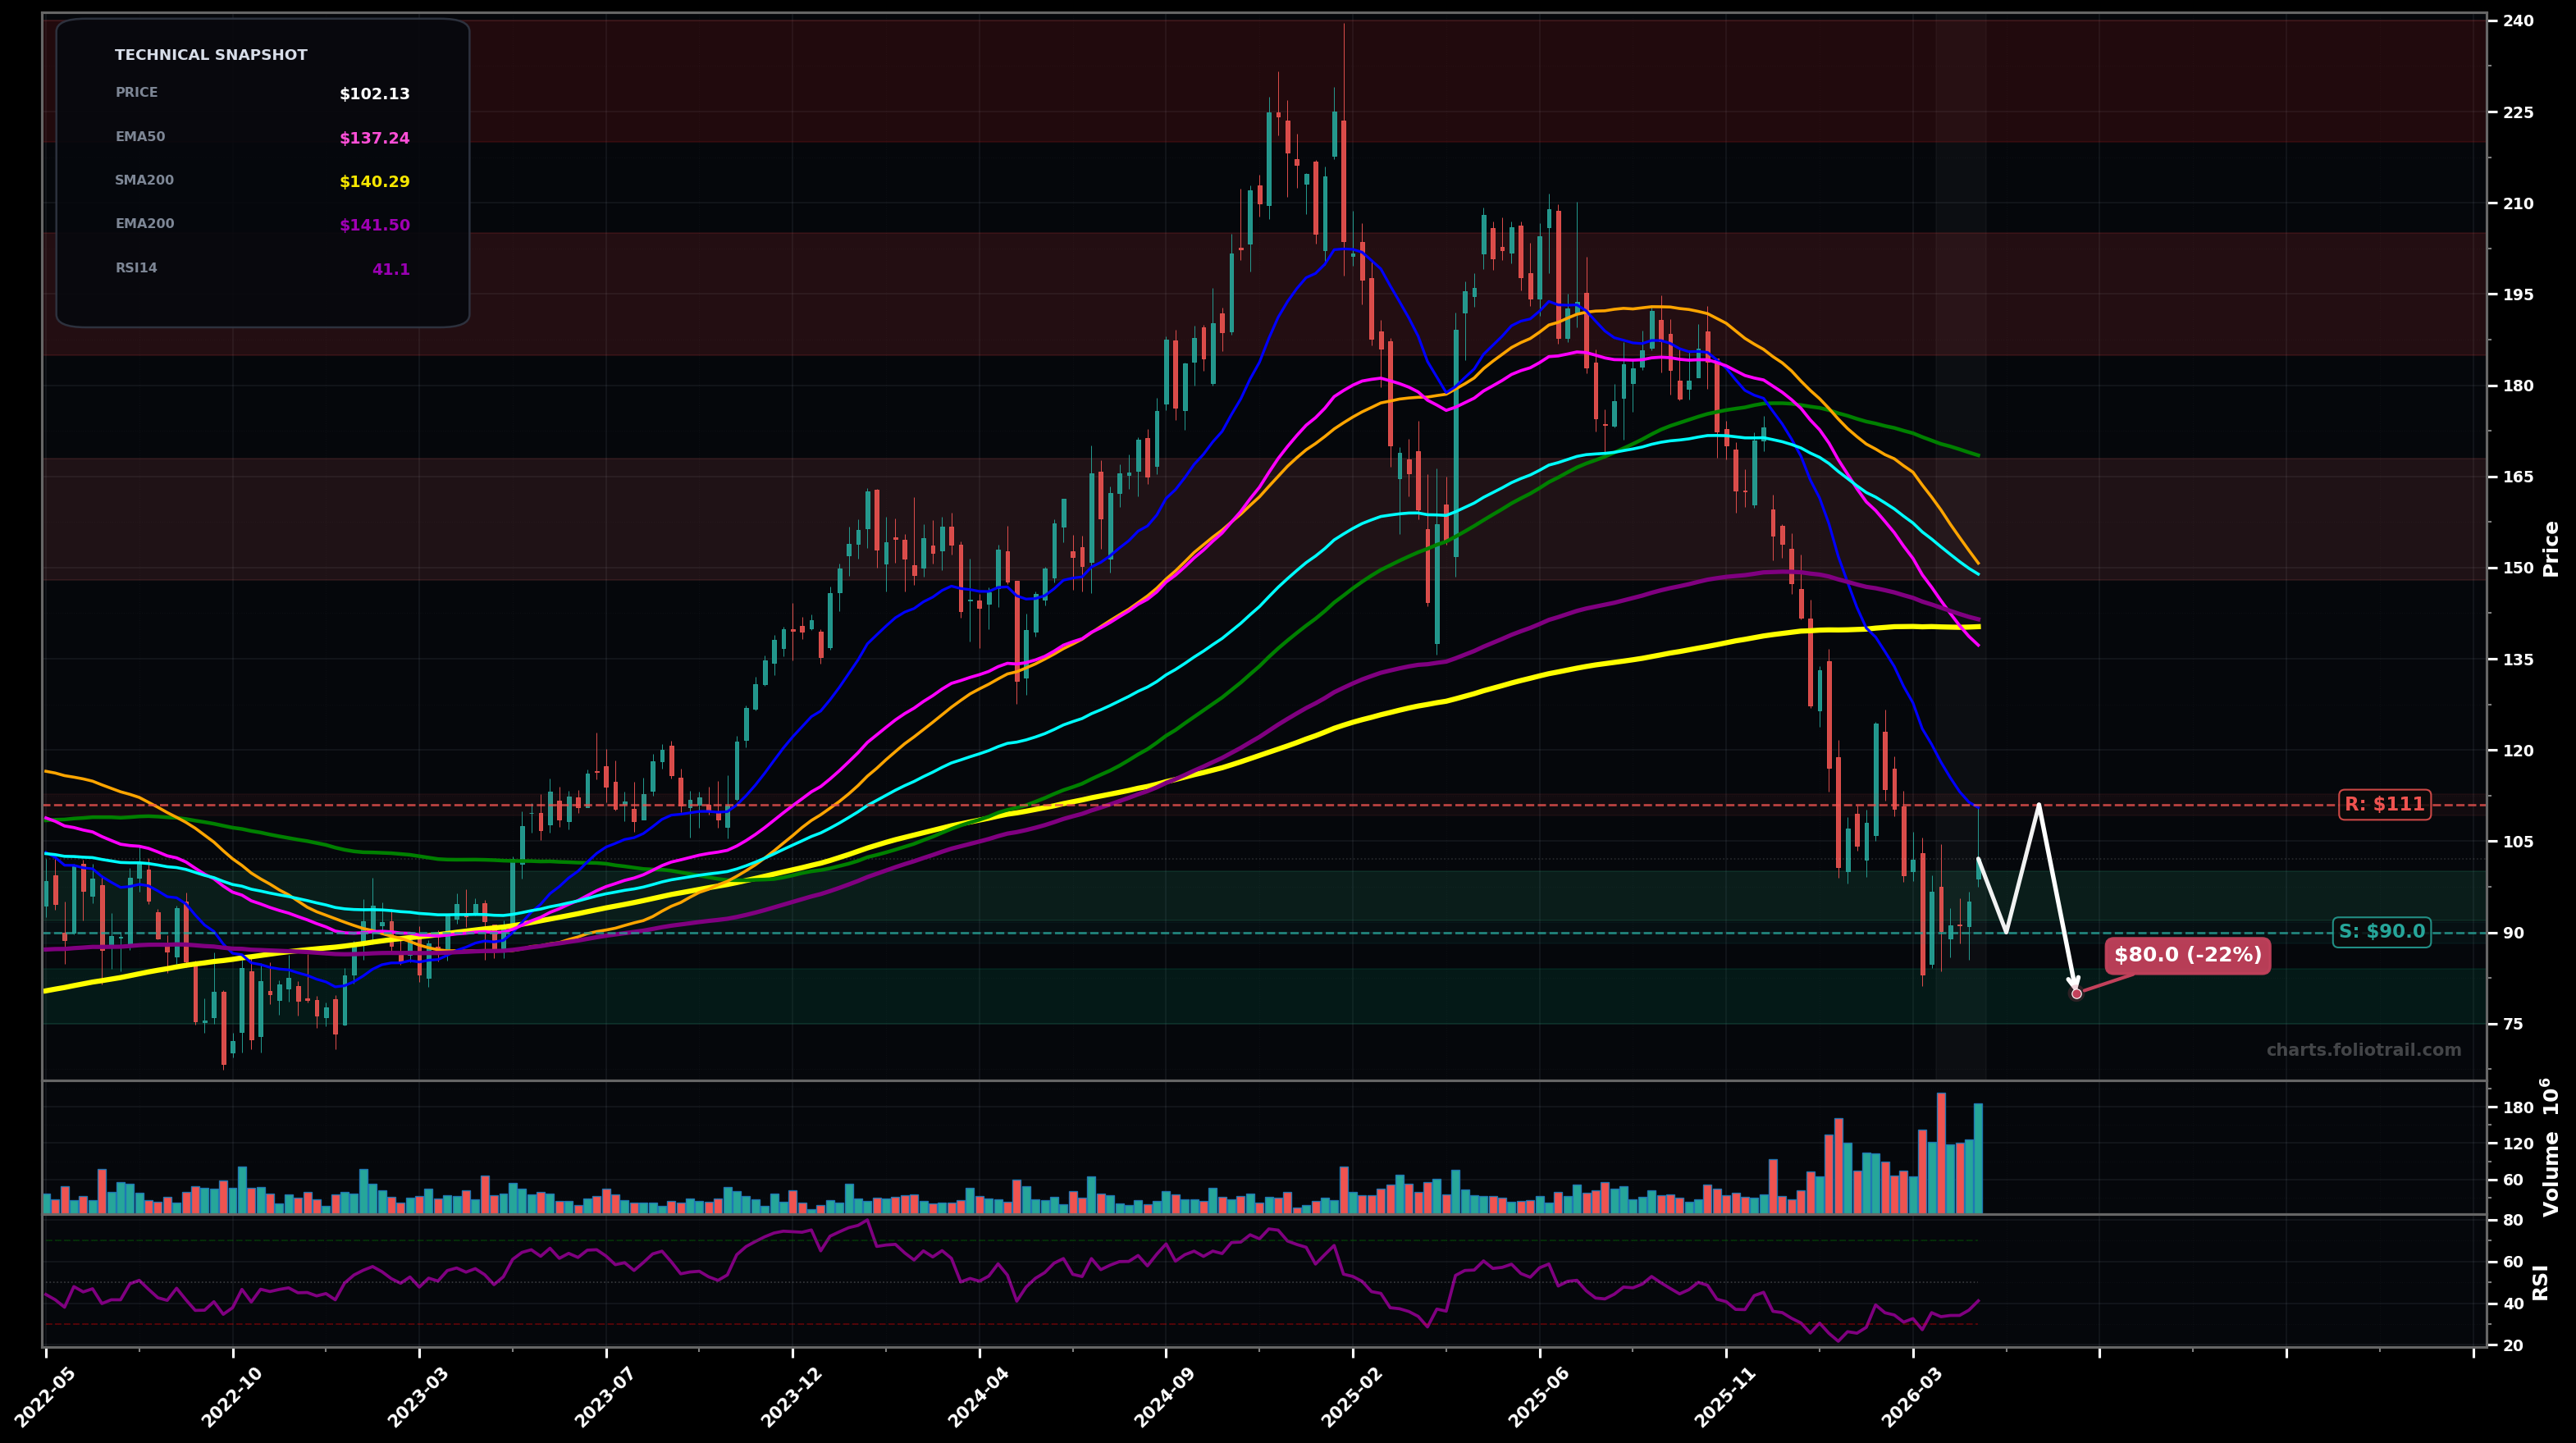
As of May 22, 2026, NOW (ServiceNow, Inc.) is in a falling knife state on the weekly chart, with a confidence level of 78%. Key support is at $90.0 and key resistance at $111. Sharp selloff to new swing lows with a small bounce; price ~$102.13 remains well below all key MAs (EMA50/100/200 and SMA50/100/200).
Bear flag / oversold bounce fails under prior breakdown zone; sellers defend the first meaningful resistance and price retests the recent lows.
Capitulation low holds and a bottoming attempt develops; price reclaims the near-term breakdown area and mean-reverts toward the falling EMA20/major prior support.
Weekly close below $90 would confirm continued falling-knife pressure
Two weekly closes back above $120 would invalidate the falling-knife call and shift toward a bottoming attempt
Scale-in only near the swing-low support ($90) and lower Fibonacci retracement/extension zones; trend is still down so entries are value/capitulation-based, not trend-following.
If mean reversion reaches the heavy MA cluster (EMA100/EMA200/SMA50-100 overhead) and prior distribution highs, trim into resistance because the larger-cycle structure remains damaged until those levels are reclaimed.
As of May 22, 2026, NOW (ServiceNow, Inc.) is in a falling knife state on the weekly chart with 78% confidence. Sharp selloff to new swing lows with a small bounce; price ~$102.13 remains well below all key MAs (EMA50/100/200 and SMA50/100/200).
On the weekly timeframe, NOW has key support at $90.0 and key resistance at $111. The most likely scenario (bearish) targets $90.0 and $80.0, with a revert level at $111.
NOW (ServiceNow, Inc.) is currently classified as falling knife on the weekly chart, with 78% confidence. Confirmation requires: Weekly close below $90 would confirm continued falling-knife pressure This would be invalidated by: Two weekly closes back above $120 would invalidate the falling-knife call and shift toward a bottoming attempt
The most likely scenario (bearish) targets $90.0 and $80.0, with a revert level at $111. The alternative scenario (bullish) targets $120 and $137.
Multi-layer AI agents analyse 200+ stocks across daily, weekly, and monthly timeframes — producing market state classifications, price scenarios with targets, and position entry/exit levels. Daily charts updated every trading day at 6 PM ET. Weekly charts refresh Fridays. Monthly charts refresh on the last trading day of each month. No paywall. No sign-up required.
Built by Foliotrail.
All content on this website — including charts, analysis, price targets, support/resistance levels, and position zones — is generated entirely by AI and provided for educational and informational purposes only.
This is not financial advice. NEXUSNOIR VENTURES SL (the operator of this website) is not a registered investment adviser or broker-dealer. You should not make investment decisions based solely on this information. Always do your own research and consult a qualified financial advisor.
By continuing, you acknowledge that you have read and agree to our full disclaimer & terms of use and privacy policy.